List of the busiest airports in the Nordic countries
This is a list of the 100 busiest airports in the Nordic countries by passengers per year, aircraft movements per year and freight and mail tonnes per year.
The list also includes yearly statistics for the busiest metropolitan airport systems and the busiest air-routes for 2012.
This transport-related list is intended to be regularly updated as new statistics become available from the relevant official authorities.
Nordic countries edit

The Nordic countries make up a region in Northern Europe and the North Atlantic which consists of Denmark, Finland, Iceland, Norway and Sweden and their associated territories which include the Faroe Islands, Greenland and Åland. "Scandinavia" is sometimes used as a synonym for the Nordic countries, although within the Nordic countries the terms are considered distinct, especially since Scandinavia is by definition made up of the countries Denmark, Norway and Sweden.
The region's five sovereign states and three autonomous regions share much common history as well as common traits in their respective societies, such as political systems and the Nordic model.
Politically, Nordic countries do not form a separate entity, but they co-operate in the Nordic Council. Linguistically, the area is heterogeneous, with three unrelated language groups, the North Germanic branch of Indo-European languages and the Finnic and Sami branches of Uralic languages as well as the Eskimo–Aleut language Greenlandic spoken in Greenland.
The Nordic countries have a combined population of approximately 27 million spread over a land area of 3.5 million km2 (Greenland accounts for 60% of the total area).
Passengers edit
At a glance edit
Graphs are unavailable due to technical issues. There is more info on Phabricator and on MediaWiki.org. |
2023 statistics edit
Greenlandic airport data is not available. Airports likely to be among top 100 include:
The ranking does not include these airports.
2022 statistics edit
Airports for which figures are not available but are likely to be among top 100 include:
The ranking does not include these airports.Greenland airport administration publishes a figure of 182,807 for Kangerlussuaq and Narsarsuaq together, and 193,623 for all other airports together except heliports.[12]
2021 statistics edit
Airports for which figures are not available but are likely to be among top 100 include:
The ranking does not include these airports.Greenland airport administration publishes a figure of 110,118 for Kangerlussuaq and Narsarsuaq together, and 146,000 for all other airports together except heliports.[12]
2020 statistics edit
Airports for which figures are not available but are likely to be among top 100 include:
The ranking does not include these airports.Greenland airport administration publishes a figure of 87,672 for Kangerlussuaq and Narsarsuaq together, and 124,762 for all other airports together.[12]
2020 COVID-19 statistics edit
For the purpose of documenting the large decline in air travel during the COVID-19 pandemic, figures for April 2020 are compared with April 2019 (for the 50 busiest airports).
2019 statistics edit
| Out of date statistics for airports without data from 2019 (with at least 20,000 passengers) | ||||||||||||||||||||||||||||||||||||||||||||||||||||||||||||||||||||||||||||||||||||||||||||||||||
|---|---|---|---|---|---|---|---|---|---|---|---|---|---|---|---|---|---|---|---|---|---|---|---|---|---|---|---|---|---|---|---|---|---|---|---|---|---|---|---|---|---|---|---|---|---|---|---|---|---|---|---|---|---|---|---|---|---|---|---|---|---|---|---|---|---|---|---|---|---|---|---|---|---|---|---|---|---|---|---|---|---|---|---|---|---|---|---|---|---|---|---|---|---|---|---|---|---|---|
| Rank | Country | Airport | City/town/village | Code (IATA/ICAO) | Total passengers | Year | ||||||||||||||||||||||||||||||||||||||||||||||||||||||||||||||||||||||||||||||||||||||||||||
| Kangerlussuaq Airport | Kangerlussuaq | SFJ/BGSF | 143,604 | 2015 | ||||||||||||||||||||||||||||||||||||||||||||||||||||||||||||||||||||||||||||||||||||||||||||||
| Nuuk Airport | Nuuk | GOH/BGGH | 72,871 | 2015 | ||||||||||||||||||||||||||||||||||||||||||||||||||||||||||||||||||||||||||||||||||||||||||||||
| Ilulissat Airport | Ilulissat | JAV/BGJN | 42,575 | 2015 | ||||||||||||||||||||||||||||||||||||||||||||||||||||||||||||||||||||||||||||||||||||||||||||||
| Narsarsuaq Airport | Narsarsuaq | UAK/BGBW | 23,083 | 2015 | ||||||||||||||||||||||||||||||||||||||||||||||||||||||||||||||||||||||||||||||||||||||||||||||
| Sisimiut Airport | Sisimiut | JHS/BGSS | 20,338 | 2015 | ||||||||||||||||||||||||||||||||||||||||||||||||||||||||||||||||||||||||||||||||||||||||||||||
2018 statistics edit
| Out of date statistics for airports without data from 2018 (with at least 20,000 passengers) | ||||||||||||||||||||||||||||||||||||||||||||||||||||||||||||||||||||||||||||||||||||||||||||||||||
|---|---|---|---|---|---|---|---|---|---|---|---|---|---|---|---|---|---|---|---|---|---|---|---|---|---|---|---|---|---|---|---|---|---|---|---|---|---|---|---|---|---|---|---|---|---|---|---|---|---|---|---|---|---|---|---|---|---|---|---|---|---|---|---|---|---|---|---|---|---|---|---|---|---|---|---|---|---|---|---|---|---|---|---|---|---|---|---|---|---|---|---|---|---|---|---|---|---|---|
| Rank | Country | Airport | City/town/village | Code (IATA/ICAO) | Total passengers | Year | ||||||||||||||||||||||||||||||||||||||||||||||||||||||||||||||||||||||||||||||||||||||||||||
| Kangerlussuaq Airport | Kangerlussuaq | SFJ/BGSF | 143,604 | 2015 | ||||||||||||||||||||||||||||||||||||||||||||||||||||||||||||||||||||||||||||||||||||||||||||||
| Nuuk Airport | Nuuk | GOH/BGGH | 72,871 | 2015 | ||||||||||||||||||||||||||||||||||||||||||||||||||||||||||||||||||||||||||||||||||||||||||||||
| Ilulissat Airport | Ilulissat | JAV/BGJN | 42,575 | 2015 | ||||||||||||||||||||||||||||||||||||||||||||||||||||||||||||||||||||||||||||||||||||||||||||||
| Lappeenranta Airport | Lappeenranta | LPP/EFLP | 35,792 | 2015 | ||||||||||||||||||||||||||||||||||||||||||||||||||||||||||||||||||||||||||||||||||||||||||||||
| Narsarsuaq Airport | Narsarsuaq | UAK/BGBW | 23,083 | 2015 | ||||||||||||||||||||||||||||||||||||||||||||||||||||||||||||||||||||||||||||||||||||||||||||||
| Sisimiut Airport | Sisimiut | JHS/BGSS | 20,338 | 2015 | ||||||||||||||||||||||||||||||||||||||||||||||||||||||||||||||||||||||||||||||||||||||||||||||
International and domestic edit
| International passengers 2018 | ||||||||||||||||||||||||||||||||||||||||||||||||||||||||||||||||||||||||||||||||||||||||||||||||||
|---|---|---|---|---|---|---|---|---|---|---|---|---|---|---|---|---|---|---|---|---|---|---|---|---|---|---|---|---|---|---|---|---|---|---|---|---|---|---|---|---|---|---|---|---|---|---|---|---|---|---|---|---|---|---|---|---|---|---|---|---|---|---|---|---|---|---|---|---|---|---|---|---|---|---|---|---|---|---|---|---|---|---|---|---|---|---|---|---|---|---|---|---|---|---|---|---|---|---|
| Rank | Country | Airport | City/town/village | Code (IATA/ICAO) | Total passengers | |||||||||||||||||||||||||||||||||||||||||||||||||||||||||||||||||||||||||||||||||||||||||||||
| 1. | Copenhagen Airport | Copenhagen | CPH/EKCH | 28,300,148 | ||||||||||||||||||||||||||||||||||||||||||||||||||||||||||||||||||||||||||||||||||||||||||||||
| 2. | Stockholm Arlanda Airport | Stockholm | ARN/ESSA | 21,549,663 | ||||||||||||||||||||||||||||||||||||||||||||||||||||||||||||||||||||||||||||||||||||||||||||||
| 3. | Helsinki Airport | Helsinki | HEL/EFHK | 17,893,738 | ||||||||||||||||||||||||||||||||||||||||||||||||||||||||||||||||||||||||||||||||||||||||||||||
| 4. | Oslo Airport | Oslo | OSL/ENGM | 16,491,834 | ||||||||||||||||||||||||||||||||||||||||||||||||||||||||||||||||||||||||||||||||||||||||||||||
| 5. | Keflavík International Airport | Keflavík/Reykjavík | KEF/BIKF | around 9.7 million[18] | ||||||||||||||||||||||||||||||||||||||||||||||||||||||||||||||||||||||||||||||||||||||||||||||
| Domestic passengers 2018 | ||||||||||||||||||||||||||||||||||||||||||||||||||||||||||||||||||||||||||||||||||||||||||||||||||
| Rank | Country | Airport | City/town/village | Code (IATA/ICAO) | Total passengers | |||||||||||||||||||||||||||||||||||||||||||||||||||||||||||||||||||||||||||||||||||||||||||||
| 1. | Oslo Airport | Oslo | OSL/ENGM | 12,003,905 | ||||||||||||||||||||||||||||||||||||||||||||||||||||||||||||||||||||||||||||||||||||||||||||||
| 2. | Stockholm Arlanda Airport | Stockholm | ARN/ESSA | 5,295,756 | ||||||||||||||||||||||||||||||||||||||||||||||||||||||||||||||||||||||||||||||||||||||||||||||
| 3. | Bergen Airport Flesland | Bergen | BGO/ENBR | 3,634,793 | ||||||||||||||||||||||||||||||||||||||||||||||||||||||||||||||||||||||||||||||||||||||||||||||
| 4. | Trondheim Airport Værnes | Trondheim | TRD/ENVA | 3,494,749 | ||||||||||||||||||||||||||||||||||||||||||||||||||||||||||||||||||||||||||||||||||||||||||||||
| 5. | Helsinki Airport | Helsinki | HEL/EFHK | 2,955,100 | ||||||||||||||||||||||||||||||||||||||||||||||||||||||||||||||||||||||||||||||||||||||||||||||
2017 statistics edit
| Airports which have left top 100 in 2017 | ||||||||||||||||||||||||||||||||||||||||||||||||||||||||||||||||||||||||||||||||||||||||||||||||||
|---|---|---|---|---|---|---|---|---|---|---|---|---|---|---|---|---|---|---|---|---|---|---|---|---|---|---|---|---|---|---|---|---|---|---|---|---|---|---|---|---|---|---|---|---|---|---|---|---|---|---|---|---|---|---|---|---|---|---|---|---|---|---|---|---|---|---|---|---|---|---|---|---|---|---|---|---|---|---|---|---|---|---|---|---|---|---|---|---|---|---|---|---|---|---|---|---|---|---|
| Rank | Country | Airport | City/town/village | Code (IATA/ICAO) | Total passengers (2017) | Change 2016–2017 | ||||||||||||||||||||||||||||||||||||||||||||||||||||||||||||||||||||||||||||||||||||||||||||
| NOR | Moss Airport Rygge | Oslo/Moss | RYG/ENRY | 0 | -100.0% | |||||||||||||||||||||||||||||||||||||||||||||||||||||||||||||||||||||||||||||||||||||||||||||
| NOR | Narvik Airport Framnes | Narvik | NVK/ENNK | 6,957 | -72.9% | |||||||||||||||||||||||||||||||||||||||||||||||||||||||||||||||||||||||||||||||||||||||||||||
| NOR | Sørkjosen Airport | Sørkjosen | SOJ/ENSR | 22,256 | -14.0% | |||||||||||||||||||||||||||||||||||||||||||||||||||||||||||||||||||||||||||||||||||||||||||||
| Some other airports with at least 20,000 (might enter top 100 in 2018) | ||||||||||||||||||||||||||||||||||||||||||||||||||||||||||||||||||||||||||||||||||||||||||||||||||
| NOR | Mehamn Airport | Mehamn | MEH/ENMH | 23,794 | -2.9% | |||||||||||||||||||||||||||||||||||||||||||||||||||||||||||||||||||||||||||||||||||||||||||||
| FIN | Pori Airport | Pori | POR/EFPO | 23,183 | +140.8% | |||||||||||||||||||||||||||||||||||||||||||||||||||||||||||||||||||||||||||||||||||||||||||||
| NOR | Hasvik Airport | Hasvik | HAA | 22,607 | +56.1% | |||||||||||||||||||||||||||||||||||||||||||||||||||||||||||||||||||||||||||||||||||||||||||||
| Out of date statistics for airports without data from 2017 (with at least 20,000 passengers) | ||||||||||||||||||||||||||||||||||||||||||||||||||||||||||||||||||||||||||||||||||||||||||||||||||
| Rank | Country | Airport | City/town/village | Code (IATA/ICAO) | Total passengers | Year | ||||||||||||||||||||||||||||||||||||||||||||||||||||||||||||||||||||||||||||||||||||||||||||
| GRL | Kangerlussuaq Airport | Kangerlussuaq | SFJ/BGSF | 143,604 | 2015 | |||||||||||||||||||||||||||||||||||||||||||||||||||||||||||||||||||||||||||||||||||||||||||||
| GRL | Nuuk Airport | Nuuk | GOH/BGGH | 72,871 | 2015 | |||||||||||||||||||||||||||||||||||||||||||||||||||||||||||||||||||||||||||||||||||||||||||||
| GRL | Ilulissat Airport | Ilulissat | JAV/BGJN | 42,575 | 2015 | |||||||||||||||||||||||||||||||||||||||||||||||||||||||||||||||||||||||||||||||||||||||||||||
| GRL | Narsarsuaq Airport | Narsarsuaq | UAK/BGBW | 23,083 | 2015 | |||||||||||||||||||||||||||||||||||||||||||||||||||||||||||||||||||||||||||||||||||||||||||||
| GRL | Sisimiut Airport | Sisimiut | JHS/BGSS | 20,338 | 2015 | |||||||||||||||||||||||||||||||||||||||||||||||||||||||||||||||||||||||||||||||||||||||||||||
International and domestic edit
| International passengers 2017 | ||||||||||||||||||||||||||||||||||||||||||||||||||||||||||||||||||||||||||||||||||||||||||||||||||
|---|---|---|---|---|---|---|---|---|---|---|---|---|---|---|---|---|---|---|---|---|---|---|---|---|---|---|---|---|---|---|---|---|---|---|---|---|---|---|---|---|---|---|---|---|---|---|---|---|---|---|---|---|---|---|---|---|---|---|---|---|---|---|---|---|---|---|---|---|---|---|---|---|---|---|---|---|---|---|---|---|---|---|---|---|---|---|---|---|---|---|---|---|---|---|---|---|---|---|
| Rank | Country | Airport | City/town/village | Code (IATA/ICAO) | Total passengers | |||||||||||||||||||||||||||||||||||||||||||||||||||||||||||||||||||||||||||||||||||||||||||||
| 1. | DEN | Copenhagen Airport | Copenhagen | CPH/EKCH | 27,566,464 | |||||||||||||||||||||||||||||||||||||||||||||||||||||||||||||||||||||||||||||||||||||||||||||
| 2. | SWE | Stockholm Arlanda Airport | Stockholm | ARN/ESSA | 21,145,249 | |||||||||||||||||||||||||||||||||||||||||||||||||||||||||||||||||||||||||||||||||||||||||||||
| 3. | FIN | Helsinki Airport | Helsinki | HEL/EFHK | 16,160,932 | |||||||||||||||||||||||||||||||||||||||||||||||||||||||||||||||||||||||||||||||||||||||||||||
| 4. | NOR | Oslo Airport | Oslo | OSL/ENGM | 15,826,395 | |||||||||||||||||||||||||||||||||||||||||||||||||||||||||||||||||||||||||||||||||||||||||||||
| 5. | ISL | Keflavík International Airport | Keflavík/Reykjavík | KEF/BIKF | around 8.7 million[18] | |||||||||||||||||||||||||||||||||||||||||||||||||||||||||||||||||||||||||||||||||||||||||||||
| Domestic passengers 2017 | ||||||||||||||||||||||||||||||||||||||||||||||||||||||||||||||||||||||||||||||||||||||||||||||||||
|---|---|---|---|---|---|---|---|---|---|---|---|---|---|---|---|---|---|---|---|---|---|---|---|---|---|---|---|---|---|---|---|---|---|---|---|---|---|---|---|---|---|---|---|---|---|---|---|---|---|---|---|---|---|---|---|---|---|---|---|---|---|---|---|---|---|---|---|---|---|---|---|---|---|---|---|---|---|---|---|---|---|---|---|---|---|---|---|---|---|---|---|---|---|---|---|---|---|---|
| Rank | Country | Airport | City/town/village | Code (IATA/ICAO) | Total passengers | |||||||||||||||||||||||||||||||||||||||||||||||||||||||||||||||||||||||||||||||||||||||||||||
| 1. | NOR | Oslo Airport | Oslo | OSL/ENGM | 11,629,232 | |||||||||||||||||||||||||||||||||||||||||||||||||||||||||||||||||||||||||||||||||||||||||||||
| 2. | SWE | Stockholm Arlanda Airport | Stockholm | ARN/ESSA | 5,477,667 | |||||||||||||||||||||||||||||||||||||||||||||||||||||||||||||||||||||||||||||||||||||||||||||
| 3. | NOR | Bergen Airport Flesland | Bergen | BGO/ENBR | 3,548,548 | |||||||||||||||||||||||||||||||||||||||||||||||||||||||||||||||||||||||||||||||||||||||||||||
| 4. | NOR | Trondheim Airport Værnes | Trondheim | TRD/ENVA | 3,468,069 | |||||||||||||||||||||||||||||||||||||||||||||||||||||||||||||||||||||||||||||||||||||||||||||
| 5. | FIN | Helsinki Airport | Helsinki | HEL/EFHK | 2,731,454 | |||||||||||||||||||||||||||||||||||||||||||||||||||||||||||||||||||||||||||||||||||||||||||||
2016 statistics edit
| Airports which have left top 100 in 2016 | ||||||||||||||||||||||||||||||||||||||||||||||||||||||||||||||||||||||||||||||||||||||||||||||||||
|---|---|---|---|---|---|---|---|---|---|---|---|---|---|---|---|---|---|---|---|---|---|---|---|---|---|---|---|---|---|---|---|---|---|---|---|---|---|---|---|---|---|---|---|---|---|---|---|---|---|---|---|---|---|---|---|---|---|---|---|---|---|---|---|---|---|---|---|---|---|---|---|---|---|---|---|---|---|---|---|---|---|---|---|---|---|---|---|---|---|---|---|---|---|---|---|---|---|---|
| Rank | Country | Airport | City/town/village | Code (IATA/ICAO) | Total passengers (2016) | Change 2015–2016 | ||||||||||||||||||||||||||||||||||||||||||||||||||||||||||||||||||||||||||||||||||||||||||||
| FIN | Lappeenranta Airport | Lappeenranta | LPP/EFLP | 0 | -100.0% | |||||||||||||||||||||||||||||||||||||||||||||||||||||||||||||||||||||||||||||||||||||||||||||
| Some other airports with at least 20,000 (might enter top 100 in 2017) | ||||||||||||||||||||||||||||||||||||||||||||||||||||||||||||||||||||||||||||||||||||||||||||||||||
| NOR | Honningsvåg Airport | Honningsvåg | HVG/ENHV | 25,410 | +7.8% | |||||||||||||||||||||||||||||||||||||||||||||||||||||||||||||||||||||||||||||||||||||||||||||
| NOR | Mehamn Airport | Mehamn | MEH/ENMH | 24,512 | +7.4% | |||||||||||||||||||||||||||||||||||||||||||||||||||||||||||||||||||||||||||||||||||||||||||||
| FIN | Enontekiö Airport | Enontekiö | ENF/EFET | 22,273 | +4.1% | |||||||||||||||||||||||||||||||||||||||||||||||||||||||||||||||||||||||||||||||||||||||||||||
| DEN | Roskilde Airport | Roskilde/Copenhagen | RKE/EKRK | 21,535 | -1.0% | |||||||||||||||||||||||||||||||||||||||||||||||||||||||||||||||||||||||||||||||||||||||||||||
| NOR | Røros Airport | Røros | RRS/ENRO | 21,042 | +2.9% | |||||||||||||||||||||||||||||||||||||||||||||||||||||||||||||||||||||||||||||||||||||||||||||
| Out of date statistics for airports without data from 2016 (with at least 20,000 passengers) | ||||||||||||||||||||||||||||||||||||||||||||||||||||||||||||||||||||||||||||||||||||||||||||||||||
| Rank | Country | Airport | City/town/village | Code (IATA/ICAO) | Total passengers | Year | ||||||||||||||||||||||||||||||||||||||||||||||||||||||||||||||||||||||||||||||||||||||||||||
| GRL | Kangerlussuaq Airport | Kangerlussuaq | SFJ/BGSF | 143,604 | 2015 | |||||||||||||||||||||||||||||||||||||||||||||||||||||||||||||||||||||||||||||||||||||||||||||
| GRL | Nuuk Airport | Nuuk | GOH/BGGH | 72,871 | 2015 | |||||||||||||||||||||||||||||||||||||||||||||||||||||||||||||||||||||||||||||||||||||||||||||
| GRL | Ilulissat Airport | Ilulissat | JAV/BGJN | 42,575 | 2015 | |||||||||||||||||||||||||||||||||||||||||||||||||||||||||||||||||||||||||||||||||||||||||||||
| GRL | Narsarsuaq Airport | Narsarsuaq | UAK/BGBW | 23,083 | 2015 | |||||||||||||||||||||||||||||||||||||||||||||||||||||||||||||||||||||||||||||||||||||||||||||
| GRL | Sisimiut Airport | Sisimiut | JHS/BGSS | 20,338 | 2015 | |||||||||||||||||||||||||||||||||||||||||||||||||||||||||||||||||||||||||||||||||||||||||||||
2015 statistics edit
| Airports which have left top 100 in 2015 | ||||||||||||||||||||||||||||||||||||||||||||||||||||||||||||||||||||||||||||||||||||||||||||||||||
|---|---|---|---|---|---|---|---|---|---|---|---|---|---|---|---|---|---|---|---|---|---|---|---|---|---|---|---|---|---|---|---|---|---|---|---|---|---|---|---|---|---|---|---|---|---|---|---|---|---|---|---|---|---|---|---|---|---|---|---|---|---|---|---|---|---|---|---|---|---|---|---|---|---|---|---|---|---|---|---|---|---|---|---|---|---|---|---|---|---|---|---|---|---|---|---|---|---|---|
| Rank | Country | Airport | City/town/village | Code (IATA/ICAO) | Total passengers (2015) | Change 2014–2015 | ||||||||||||||||||||||||||||||||||||||||||||||||||||||||||||||||||||||||||||||||||||||||||||
| NOR | Skien Airport | Skien | SKE/ENSN | 13,411 | -59.5% | |||||||||||||||||||||||||||||||||||||||||||||||||||||||||||||||||||||||||||||||||||||||||||||
| SWE | Göteborg City Airport | Gothenburg | GSE/ESGP | 2,121 | -99.7% | |||||||||||||||||||||||||||||||||||||||||||||||||||||||||||||||||||||||||||||||||||||||||||||
| Some other airports with at least 20,000 (might enter top 100 in 2016) | ||||||||||||||||||||||||||||||||||||||||||||||||||||||||||||||||||||||||||||||||||||||||||||||||||
| NOR | Sørkjosen Airport | Sørkjosen | SOJ/ENSR | 23,804 | ||||||||||||||||||||||||||||||||||||||||||||||||||||||||||||||||||||||||||||||||||||||||||||||
| NOR | Honningsvåg Airport | Honningsvåg | HVG/ENHV | 23,580 | ||||||||||||||||||||||||||||||||||||||||||||||||||||||||||||||||||||||||||||||||||||||||||||||
| NOR | Mehamn Airport | Mehamn | MEH/ENMH | 22,813 | ||||||||||||||||||||||||||||||||||||||||||||||||||||||||||||||||||||||||||||||||||||||||||||||
| DEN | Roskilde Airport | Roskilde/Copenhagen | RKE/EKRK | 21,758 | ||||||||||||||||||||||||||||||||||||||||||||||||||||||||||||||||||||||||||||||||||||||||||||||
| FIN | Enontekiö Airport | Enontekiö | ENF/EFET | 21,390 | ||||||||||||||||||||||||||||||||||||||||||||||||||||||||||||||||||||||||||||||||||||||||||||||
| NOR | Røros Airport | Røros | RRS/ENRO | 20,456 | ||||||||||||||||||||||||||||||||||||||||||||||||||||||||||||||||||||||||||||||||||||||||||||||
| SWE | Lycksele Airport | Lycksele | LYC/ESNL | 20,023 | ||||||||||||||||||||||||||||||||||||||||||||||||||||||||||||||||||||||||||||||||||||||||||||||
| Out of date statistics for airports without data from 2015 (with at least 20,000 passengers) | ||||||||||||||||||||||||||||||||||||||||||||||||||||||||||||||||||||||||||||||||||||||||||||||||||
|---|---|---|---|---|---|---|---|---|---|---|---|---|---|---|---|---|---|---|---|---|---|---|---|---|---|---|---|---|---|---|---|---|---|---|---|---|---|---|---|---|---|---|---|---|---|---|---|---|---|---|---|---|---|---|---|---|---|---|---|---|---|---|---|---|---|---|---|---|---|---|---|---|---|---|---|---|---|---|---|---|---|---|---|---|---|---|---|---|---|---|---|---|---|---|---|---|---|---|
| Rank | Country | Airport | City/town/village | Code (IATA/ICAO) | Total passengers | Year | ||||||||||||||||||||||||||||||||||||||||||||||||||||||||||||||||||||||||||||||||||||||||||||
| GRL | Kangerlussuaq Airport | Kangerlussuaq | SFJ/BGSF | 143,604 | 2015 | |||||||||||||||||||||||||||||||||||||||||||||||||||||||||||||||||||||||||||||||||||||||||||||
| GRL | Nuuk Airport | Nuuk | GOH/BGGH | 72,871 | 2015 | |||||||||||||||||||||||||||||||||||||||||||||||||||||||||||||||||||||||||||||||||||||||||||||
| GRL | Ilulissat Airport | Ilulissat | JAV/BGJN | 42,575 | 2015 | |||||||||||||||||||||||||||||||||||||||||||||||||||||||||||||||||||||||||||||||||||||||||||||
| ISL | Ísafjörður Airport | Ísafjörður | IFJ/BIIS | 35,577 | 2013 | |||||||||||||||||||||||||||||||||||||||||||||||||||||||||||||||||||||||||||||||||||||||||||||
| GRL | Narsarsuaq Airport | Narsarsuaq | UAK/BGBW | 23,083 | 2015 | |||||||||||||||||||||||||||||||||||||||||||||||||||||||||||||||||||||||||||||||||||||||||||||
| GRL | Sisimiut Airport | Sisimiut | JHS/BGSS | 20,338 | 2015 | |||||||||||||||||||||||||||||||||||||||||||||||||||||||||||||||||||||||||||||||||||||||||||||
2014 statistics edit
| Out of date statistics for airports without data from 2014 (with at least 20,000 passengers) | ||||||||||||||||||||||||||||||||||||||||||||||||||||||||||||||||||||||||||||||||||||||||||||||||||
|---|---|---|---|---|---|---|---|---|---|---|---|---|---|---|---|---|---|---|---|---|---|---|---|---|---|---|---|---|---|---|---|---|---|---|---|---|---|---|---|---|---|---|---|---|---|---|---|---|---|---|---|---|---|---|---|---|---|---|---|---|---|---|---|---|---|---|---|---|---|---|---|---|---|---|---|---|---|---|---|---|---|---|---|---|---|---|---|---|---|---|---|---|---|---|---|---|---|---|
| Rank | Country | Airport | City/town/village | Code (IATA/ICAO) | Total passengers | Year | ||||||||||||||||||||||||||||||||||||||||||||||||||||||||||||||||||||||||||||||||||||||||||||
| GRL | Kangerlussuaq Airport | Kangerlussuaq | SFJ/BGSF | 134,831 | 2014 | |||||||||||||||||||||||||||||||||||||||||||||||||||||||||||||||||||||||||||||||||||||||||||||
| GRL | Nuuk Airport | Nuuk | GOH/BGGH | 68,951 | 2014 | |||||||||||||||||||||||||||||||||||||||||||||||||||||||||||||||||||||||||||||||||||||||||||||
| GRL | Ilulissat Airport | Ilulissat | JAV/BGJN | 39,703 | 2014 | |||||||||||||||||||||||||||||||||||||||||||||||||||||||||||||||||||||||||||||||||||||||||||||
| ISL | Ísafjörður Airport | Ísafjörður | IFJ/BIIS | 35,577 | 2013 | |||||||||||||||||||||||||||||||||||||||||||||||||||||||||||||||||||||||||||||||||||||||||||||
| GRL | Narsarsuaq Airport | Narsarsuaq | UAK/BGBW | 23,360 | 2014 | |||||||||||||||||||||||||||||||||||||||||||||||||||||||||||||||||||||||||||||||||||||||||||||
| GRL | Sisimiut Airport | Sisimiut | JHS/BGSS | 20,085 | 2014 | |||||||||||||||||||||||||||||||||||||||||||||||||||||||||||||||||||||||||||||||||||||||||||||
| Some airports that might enter top 100 in 2015 (at least 20,000) or have left it in 2014 | ||||||||||||||||||||||||||||||||||||||||||||||||||||||||||||||||||||||||||||||||||||||||||||||||||
|---|---|---|---|---|---|---|---|---|---|---|---|---|---|---|---|---|---|---|---|---|---|---|---|---|---|---|---|---|---|---|---|---|---|---|---|---|---|---|---|---|---|---|---|---|---|---|---|---|---|---|---|---|---|---|---|---|---|---|---|---|---|---|---|---|---|---|---|---|---|---|---|---|---|---|---|---|---|---|---|---|---|---|---|---|---|---|---|---|---|---|---|---|---|---|---|---|---|---|
| Rank | Country | Airport | City/town/village | Code (IATA/ICAO) | Total passengers (2014) | |||||||||||||||||||||||||||||||||||||||||||||||||||||||||||||||||||||||||||||||||||||||||||||
| FIN | Pori Airport | Pori | POR/EFPO | 24,983 | ||||||||||||||||||||||||||||||||||||||||||||||||||||||||||||||||||||||||||||||||||||||||||||||
| DEN | Roskilde Airport | Roskilde/Copenhagen | RKE/EKRK | 24,082 | ||||||||||||||||||||||||||||||||||||||||||||||||||||||||||||||||||||||||||||||||||||||||||||||
| SWE | Lycksele Airport | Lycksele | LYC/ESNL | 21,069 | ||||||||||||||||||||||||||||||||||||||||||||||||||||||||||||||||||||||||||||||||||||||||||||||
International and domestic edit
| International passengers 2014 | ||||||||||||||||||||||||||||||||||||||||||||||||||||||||||||||||||||||||||||||||||||||||||||||||||
|---|---|---|---|---|---|---|---|---|---|---|---|---|---|---|---|---|---|---|---|---|---|---|---|---|---|---|---|---|---|---|---|---|---|---|---|---|---|---|---|---|---|---|---|---|---|---|---|---|---|---|---|---|---|---|---|---|---|---|---|---|---|---|---|---|---|---|---|---|---|---|---|---|---|---|---|---|---|---|---|---|---|---|---|---|---|---|---|---|---|---|---|---|---|---|---|---|---|---|
| Rank | Country | Airport | City/town/village | Code (IATA/ICAO) | Total passengers | |||||||||||||||||||||||||||||||||||||||||||||||||||||||||||||||||||||||||||||||||||||||||||||
| 1. | DEN | Copenhagen Airport | Copenhagen | CPH/EKCH | 23,680,303 | |||||||||||||||||||||||||||||||||||||||||||||||||||||||||||||||||||||||||||||||||||||||||||||
| 2. | SWE | Stockholm Arlanda Airport | Stockholm | ARN/ESSA | 17,328,325 | |||||||||||||||||||||||||||||||||||||||||||||||||||||||||||||||||||||||||||||||||||||||||||||
| 3. | FIN | Helsinki Airport | Helsinki | HEL/EFHK | 13,441,567 | |||||||||||||||||||||||||||||||||||||||||||||||||||||||||||||||||||||||||||||||||||||||||||||
| 4. | NOR | Oslo Airport | Oslo | OSL/ENGM | 13,361,608 | |||||||||||||||||||||||||||||||||||||||||||||||||||||||||||||||||||||||||||||||||||||||||||||
| 5. | SWE | Göteborg Landvetter Airport | Gothenburg | GOT/ESGG | 3,846,032 | |||||||||||||||||||||||||||||||||||||||||||||||||||||||||||||||||||||||||||||||||||||||||||||
| Domestic passengers 2014 | ||||||||||||||||||||||||||||||||||||||||||||||||||||||||||||||||||||||||||||||||||||||||||||||||||
|---|---|---|---|---|---|---|---|---|---|---|---|---|---|---|---|---|---|---|---|---|---|---|---|---|---|---|---|---|---|---|---|---|---|---|---|---|---|---|---|---|---|---|---|---|---|---|---|---|---|---|---|---|---|---|---|---|---|---|---|---|---|---|---|---|---|---|---|---|---|---|---|---|---|---|---|---|---|---|---|---|---|---|---|---|---|---|---|---|---|---|---|---|---|---|---|---|---|---|
| Rank | Country | Airport | City/town/village | Code (IATA/ICAO) | Total passengers | |||||||||||||||||||||||||||||||||||||||||||||||||||||||||||||||||||||||||||||||||||||||||||||
| 1. | NOR | Oslo Airport | Oslo | OSL/ENGM | 10,907,544 | |||||||||||||||||||||||||||||||||||||||||||||||||||||||||||||||||||||||||||||||||||||||||||||
| 2. | SWE | Stockholm Arlanda Airport | Stockholm | ARN/ESSA | 5,090,824 | |||||||||||||||||||||||||||||||||||||||||||||||||||||||||||||||||||||||||||||||||||||||||||||
| 3. | NOR | Bergen Airport Flesland | Bergen | BGO/ENBR | 3,669,600 | |||||||||||||||||||||||||||||||||||||||||||||||||||||||||||||||||||||||||||||||||||||||||||||
| 4. | NOR | Trondheim Airport Værnes | Trondheim | TRD/ENVA | 3,427,690 | |||||||||||||||||||||||||||||||||||||||||||||||||||||||||||||||||||||||||||||||||||||||||||||
| 5. | FIN | Helsinki Airport | Helsinki | HEL/EFHK | 2,507,193 | |||||||||||||||||||||||||||||||||||||||||||||||||||||||||||||||||||||||||||||||||||||||||||||
2013 statistics edit
| Unsourced statistics for 2013 (for airports with at least 30,000 passengers) | ||||||||||||||||||||||||||||||||||||||||||||||||||||||||||||||||||||||||||||||||||||||||||||||||||
|---|---|---|---|---|---|---|---|---|---|---|---|---|---|---|---|---|---|---|---|---|---|---|---|---|---|---|---|---|---|---|---|---|---|---|---|---|---|---|---|---|---|---|---|---|---|---|---|---|---|---|---|---|---|---|---|---|---|---|---|---|---|---|---|---|---|---|---|---|---|---|---|---|---|---|---|---|---|---|---|---|---|---|---|---|---|---|---|---|---|---|---|---|---|---|---|---|---|---|
| Rank | Country | Airport | City/town/village | Code (IATA/ICAO) | Total passengers | Year | ||||||||||||||||||||||||||||||||||||||||||||||||||||||||||||||||||||||||||||||||||||||||||||
| GRL | Kangerlussuaq Airport | Kangerlussuaq | SFJ/BGSF | 136,188 | 2013 | |||||||||||||||||||||||||||||||||||||||||||||||||||||||||||||||||||||||||||||||||||||||||||||
| GRL | Nuuk Airport | Nuuk | GOH/BGGH | 69,732 | 2013 | |||||||||||||||||||||||||||||||||||||||||||||||||||||||||||||||||||||||||||||||||||||||||||||
| GRL | Ilulissat Airport | Ilulissat | JAV/BGJN | 40,241 | 2013 | |||||||||||||||||||||||||||||||||||||||||||||||||||||||||||||||||||||||||||||||||||||||||||||
| But there is a source saying 159432 passengers for Kangerlussuaq+Narsarsuaq, and 193812 for the other Greenlandic airports together[19] | ||||||||||||||||||||||||||||||||||||||||||||||||||||||||||||||||||||||||||||||||||||||||||||||||||
2012 statistics edit
Aircraft movements edit
Note: The statistics provided below do not include any movements by aircraft registered as military or touch and goes.
2012 statistics edit
Freight and mail tonnes edit
Note: The statistics below are provided in metric tonnes with three decimal digits, i.e. with an accuracy of number of kilograms handled at each airport. The statistics do not include belly cargo transported on regular or charter passenger flights.
2012 statistics edit
| Rank | Country | Airport | City/town/village | Code (IATA/ICAO) | Total tonnes | Rank change | Change 2011–2012 |
|---|---|---|---|---|---|---|---|
| 1. | FIN | Helsinki Airport | Helsinki | HEL/EFHK | 192,161.494 | +12.8% | |
| 2. | DEN | Copenhagen Airport | Copenhagen | CPH/EKCH | 157,359.017 | +7.2% | |
| 3. | NOR | Oslo Airport | Oslo | OSL/ENGM | 105,204.388 | +7.5% | |
| 4. | SWE | Stockholm Arlanda Airport | Stockholm | ARN/ESSA | 74,656.039 | -12.0% | |
| 5. | ISL | Keflavík International Airport | Keflavík/Reykjavík | KEF/BIKF | 38,986.000 | +6.3% | |
| 6. | SWE | Göteborg Landvetter Airport | Gothenburg | GOT/ESGG | 36,533.204 | -16.3% | |
| 7. | SWE | Malmö Airport | Malmö | MMX/ESMS | 27,571.000 | -16.9% | |
| 8. | DEN | Billund Airport | Billund | BLL/EKBI | 14,665.357 | +1.3% | |
| 9. | FIN | Turku Airport | Turku | TKU/EFTU | 8,011.953 | +2.0% | |
| 10. | NOR | Bergen Airport Flesland | Bergen | BGO/ENBR | 6,747.425 | +0.5% | |
| 11. | SWE | Örebro Airport | Örebro | ORB/ESOE | 6,415.779 | +9.3% | |
| 12. | SWE | Jönköping Airport | Jönköping | JKG/ESGJ | 5,323.046 | -2.4% | |
| 13. | NOR | Trondheim Airport Værnes | Trondheim | TRD/ENVA | 5,106.631 | +4.3% | |
| 14. | SWE | Stockholm-Västerås Airport | Västerås/Stockholm | VST/ESOW | 5,063.880 | -11.7% | |
| 15. | SWE | Umeå Airport | Umeå | UME/ESNU | 5,032.683 | +6.0% | |
| 16. | NOR | Stavanger Airport Sola | Stavanger | SVG/ENZV | 4,153.074 | -17.2% | |
| 17. | NOR | Molde Airport Årø | Molde | MOL/ENML | 2,933.177 | +4.8% | |
| 18. | NOR | Tromsø Airport Langnes | Tromsø | TOS/ENTC | 2,621.612 | -5.2% | |
| 19. | SWE | Sundsvall Härnösand Airport | Sundsvall/Härnösand | SDL/ESNN | 2,577.405 | +18.9% | |
| 20. | FIN | Oulu Airport | Oulu | OUL/EFOU | 2,043.348 | -3.2% | |
| 21. | NOR | Bodø Airport | Bodø | BOO/ENBO | 1,909.181 | -7.8% | |
| 22. | SWE | Luleå Airport | Luleå | LLA/ESPA | 1,842.968 | +26.7% | |
| 23. | ALA | Mariehamn Airport | Mariehamn | MHQ/EFMA | 1,415.996 | +84.0% | |
| 24. | ISL | Reykjavík Airport | Reykjavík | RKV/BIRK | 1,047.100 | +3.2% | |
| 25. | SWE | Visby Airport | Visby | VBY/ESSV | 750.389 | -8.1% | |
| 26. | NOR | Ålesund Airport Vigra | Ålesund | AES/ENAL | 735.956 | +4.4% | |
| 27. | SWE | Karlstad Airport | Karlstad | KSD/ESOK | 735.050 | -8.1% | |
| 28. | NOR | Kirkenes Airport Høybuktmoen | Kirkenes | KKN/ENKR | 664.894 | -3.1% | |
| 29. | FAE | Vagar Airport | Vágar/Faroe Islands | FAE/EKVG | 610.756 | +18.7% | |
| 30. | NOR | Svalbard Airport Longyear | Longyearbyen | LYR/ENSB | 608.369 | -25.3% | |
| 31. | NOR | Harstad/Narvik Airport Evenes | Harstad/Narvik | EVE/ENEV | 549.758 | +4.3% | |
| 32. | SWE | Lapland Airport | Gällivare | GEV/ESNG | 504.038 | -5.7% | |
| 33. | SWE | Kiruna Airport | Kiruna | KRN/ESNQ | 487.756 | -17.1% | |
| 34. | ISL | Akureyri International Airport | Akureyri | AEY/BIAR | 478.800 | +13.6% | |
| 35. | NOR | Alta Airport | Alta | ALF/ENAT | 450.743 | +16.2% | |
| 36. | FIN | Tampere-Pirkkala Airport | Tampere | TMP/EFTP | 401.032 | -26.0% | |
| 37. | NOR | Lakselv Airport Banak | Lakselv | LKL/ENNA | 330.131 | -9.1% | |
| 38. | NOR | Torp Sandefjord Airport | Sandefjord | TRF/ENTO | 311.259 | -29.1% | |
| 39. | SWE | Bromma Stockholm Airport | Stockholm | BMA/ESSB | 306.972 | -29.5% | |
| 40. | NOR | Kristiansand Airport Kjevik | Kristiansand S. | KRS/ENCN | 283.146 | -14.5% | |
| 41. | NOR | Vadsø Airport | Vadsø | VDS/ENVD | 273.064 | +1.5% | |
| 42. | SWE | Stockholm Skavsta Airport | Nyköping/Stockholm | NYO/ESKN | 265.402 | +4757.3% | |
| 43. | NOR | Mosjøen Airport Kjærstad | Mosjøen | MJF/ENMS | 243.092 | -5.0% | |
| 44. | NOR | Sandnessjøen Airport Stokka | Sandnessjøen | SSJ/ENST | 239.395 | +3.9% | |
| 45. | NOR | Brønnøysund Airport Brønnøy | Brønnøysund | BNN/ENBN | 235.269 | -16.7% | |
| 46. | NOR | Haugesund Airport Karmøy | Haugesund | HAU/ENHD | 233.137 | -5.0% | |
| 47. | NOR | Hammerfest Airport | Hammerfest | HFT/ENHF | 228.116 | -8.5% | |
| 48. | NOR | Kristiansund Airport Kvernberget | Kristiansund N. | KSU/ENKB | 225.759 | +12.8% | |
| 49. | ISL | Egilsstaðir International Airport | Egilsstaðir | EGS/BIEG | 200.400 | +3.9% | |
| 50. | NOR | Leknes Airport | Leknes | LKN/ENLK | 188.054 | -13.8% | |
| 51. | NOR | Mo i Rana Airport Røssvoll | Mo i Rana | MQN/ENRA | 183.860 | -7.8% | |
| 52. | NOR | Svolvær Airport Helle | Svolvær | SVJ/ENSH | 183.857 | -7.8% | |
| 53. | FIN | Rovaniemi Airport | Rovaniemi | RVN/EFRO | 144.221 | -17.3% | |
| 54. | NOR | Røros Airport | Røros | RRS/ENRO | 135.917 | +11.0% | |
| 55. | FIN | Kuopio Airport | Kuopio | KUO/EFKU | 109.571 | +244.4% | |
| 56. | DEN | Esbjerg Airport | Esbjerg | EBJ/EKEB | 106.523 | -30.3% | |
| 57. | ISL | Ísafjörður Airport | Ísafjörður | IFJ/BIIS | 102.100 | +2.2% | |
| 58. | DEN | Aalborg Airport | Aalborg | AAL/EKYT | 95.758 | +195.8% | |
| 59. | SWE | Åre Östersund Airport | Åre/Östersund | OSD/ESNZ | 94.221 | +25.7% | |
| 60. | SWE | Norrköping Airport | Norrköping | NRK/ESSP | 81.950 | -8.4% | |
| 61. | ISL | Vestmannaeyjar Airport | Vestmannaeyjar | VEY/BIVM | 80.700 | +10.9% | |
| 62. | SWE | Örnsköldsvik Airport | Örnsköldsvik | OER/ESNO | 65.683 | -62.9% | |
| 63. | NOR | Bardufoss Airport | Bardufoss | BDU/ENDU | 47.077 | -9.2% | |
| 64. | NOR | Florø Airport | Florø | FRO/ENFL | 45.895 | -1.5% | |
| 65. | NOR | Båtsfjord Airport | Båtsfjord | BJF/ENBS | 45.065 | -44.8% | |
| 66. | NOR | Stokmarknes Airport Skagen | Stokmarknes | SKN/ENSK | 44.277 | +3.5% | |
| 67. | NOR | Førde Airport Bringeland | Førde | FDE/ENBL | 40.009 | +3.4% | |
| 68. | FIN | Kajaani Airport | Kajaani | KAJ/EFKI | 38.326 | -18.4% | |
| 69. | NOR | Honningsvåg Airport Valan | Honningsvåg | HVG/ENHV | 35.712 | -24.8% | |
| 70. | ISL | Bíldudalur Airport | Bíldudalur | BIU/BIBD | 35.400 | -5.3% | |
| 71. | ISL | Vopnafjörður Airport | Vopnafjörður | VPN/BIVO | 34.100 | +9.3% | |
| 72. | FIN | Joensuu Airport | Joensuu | JOE/EFJO | 33.092 | -6.5% | |
| 73. | NOR | Ørsta–Volda Airport, Hovden | Ørsta/Volda | HOV/ENOV | 32.792 | -2.8% | |
| 74. | NOR | Berlevåg Airport | Berlevåg | BVG/ENBV | 32.261 | -13.4% | |
| 75. | NOR | Værøy Heliport | Værøy | VRY/ENVR | 31.997 | -9.3% | |
| 76. | NOR | Hasvik Airport | Hasvik | HAA/ENHK | 31.174 | -0.5% | |
| 77. | NOR | Namsos Airport | Namsos | TRD/ENNM | 31.166 | +72.0% | |
| 78. | NOR | Mehamn Airport | Mehamn | MEH/ENMH | 30.980 | -18.2% | |
| 79. | ISL | Hornafjörður Airport | Höfn | HFN/BIHN | 28.200 | -5.7% | |
| 80. | FIN | Kemi-Tornio Airport | Kemi/Tornio | KEM/EFKE | 28.085 | +22.2% | |
| 81. | NOR | Vardø Airport Svartnes | Vardø | VAW/ENSS | 25.222 | -3.8% | |
| 82. | NOR | Narvik Airport Framnes | Narvik | NVK/ENNK | 23.488 | -11.2% | |
| 83. | NOR | Røst Airport | Røst | RET/ENRS | 22.590 | +62.4% | |
| 84. | NOR | Sogndal Airport Haukåsen | Sogndal | SOG/ENSG | 22.195 | -28.3% | |
| 85. | NOR | Sandane Airport Anda | Sandane | SDN/ENSD | 21.641 | -14.9% | |
| 86. | FIN | Kokkola-Pietarsaari Airport | Kokkola/Jakobstad | KOK/EFKK | 21.484 | -12.2% | |
| 87. | NOR | Rørvik Airport Ryum | Rørvik | RVK/ENRM | 19.761 | -25.1% | |
| 88. | NOR | Stord Airport Sørstokken | Leirvik | SRP/ENSO | 16.538 | -20.3% | |
| 89. | NOR | Andøya Airport Andenes | Andenes | ANX/ENAN | 15.224 | -28.8% | |
| 90. | FIN | Vaasa Airport | Vaasa | VAA/EFVA | 14.827 | -5.9% | |
| 91. | DEN | Bornholm Airport | Rønne | RNN/EKRN | 14.515 | -72.5% | |
| 92. | SWE | Ronneby Airport | Ronneby/Karlskrona | RNB/ESDF | 13.750 | +30.1% | |
| 93. | DEN | Aarhus Airport | Aarhus | AAR/EKAH | 12.191 | -97.1% | |
| 94. | SWE | Lycksele Airport | Lycksele | LYC/ESNL | 11.370 | +57.3% | |
| 95. | FIN | Jyväskylä Airport | Jyväskylä | JYV/EFJY | 11.257 | -35.9% | |
| 96. | FIN | Kittilä Airport | Kittilä | KTT/EFKT | 9.209 | +13.1% | |
| 97. | NOR | Sørkjosen Airport | Sørkjosen | SOJ/ENSR | 8.722 | +12.8% | |
| 98. | SWE | Halmstad City Airport | Halmstad | HAD/ESMT | 5.458 | -54.1% | |
| 99. | SWE | Höga Kusten Airport | Kramfors/Sollefteå | KRF/ESNK | 4.545 | +13.0% | |
| 100. | DEN | Karup Airport | Karup | KRP/EKKA | 3.843 | +27.6% |
Greenlandic airports are excluded from this list because of lack of information. The ranking does not include Greenlandic airports.
Busiest metropolitan air-traffic regions edit
2016 statistics edit
| Rank | Country | Metropolitan area | Total passengers | Rank change | Change 2014–2015 | Airport(s) included |
|---|---|---|---|---|---|---|
| 1. | DEN/SWE | Metropolitan Copenhagen / Øresund Region | 31,678,207 | +8.5% | Copenhagen Airport, Malmö Airport, Roskilde Airport and Ängelholm Helsingborg Airport | |
| 2. | SWE | Metropolitan Stockholm | 29,356,148 | +6.5% | Stockholm Arlanda Airport, Stockholm Skavsta Airport, Bromma Stockholm Airport and Stockholm Västerås Airport | |
| 3. | NOR | Greater Oslo Region | 28,547,334 | +2.4% | Oslo Gardermoen Airport, Oslo Rygge Airport and Oslo Torp Sandefjord Airport |
2015 statistics edit
| Rank | Country | Metropolitan area | Total passengers | Rank change | Change 2014–2015 | Airport(s) included |
|---|---|---|---|---|---|---|
| 1. | DEN/SWE | Metropolitan Copenhagen / Øresund Region | 29,213,617 | +3.8% | Copenhagen Airport, Malmö Airport, Roskilde Airport and Ängelholm Helsingborg Airport | |
| 2. | NOR | Greater Oslo Region | 27,862,892 | +0.1% | Oslo Gardermoen Airport, Oslo Rygge Airport and Oslo Torp Sandefjord Airport | |
| 3. | SWE | Metropolitan Stockholm | 27,556,768 | +3.6% | Stockholm Arlanda Airport, Stockholm Skavsta Airport, Bromma Stockholm Airport and Stockholm Västerås Airport |
2014 statistics edit
| Rank | Country | Metropolitan area | Total passengers | Rank change | Change 2013–2014 | Airport(s) included |
|---|---|---|---|---|---|---|
| 1. | DEN/SWE | Metropolitan Copenhagen / Øresund Region | 28,136,631 | +5.6% | Copenhagen Airport, Malmö Airport, Roskilde Airport and Ängelholm Helsingborg Airport | |
| 2. | NOR | Greater Oslo Region | 27,839,889 | +4.3% | Oslo Gardermoen Airport, Oslo Rygge Airport and Oslo Torp Sandefjord Airport | |
| 3. | SWE | Metropolitan Stockholm | 26,597,749 | +5.2% | Stockholm Arlanda Airport, Stockholm Skavsta Airport, Bromma Stockholm Airport and Stockholm Västerås Airport |
2013 statistics (provisional) edit
2012 statistics edit
Passengers edit
Aircraft movements edit
Note: The statistics provided below do not include any movements by aircraft registered as military or touch and goes.
| Rank | Country | Metropolitan area | Total movements | Rank change | Change 2011–2012 | Airport(s) included |
|---|---|---|---|---|---|---|
| 1. | DEN/SWE | Metropolitan Copenhagen / Øresund Region | 366,329 | -1.2% | Copenhagen Airport, Malmö Airport, Roskilde Airport and Ängelholm Helsingborg Airport | |
| 2. | SWE | Metropolitan Stockholm | 327,918 | -4.3% | Stockholm Arlanda Airport, Stockholm Skavsta Airport, Bromma Stockholm Airport and Stockholm Västerås Airport | |
| 3. | NOR | Greater Oslo Region | 298,811 | +3.5% | Oslo Airport, Moss Airport Rygge and Torp Sandefjord Airport | |
| 4. | FIN | Greater Helsinki | 201,882 | -10.3% | Helsinki Airport and Helsinki-Malmi Airport | |
| 5. | ICE | Capital Region | 110,101 | -0.1% | Keflavík International Airport and Reykjavík Airport | |
| 6. | SWE | Metropolitan Gothenburg | 109,770 | -12.1% | Göteborg Landvetter Airport and Göteborg City Airport | |
| 7. | NOR | Greater Bergen Region | 103,841 | +0.6% | Bergen Airport Flesland | |
| 8. | NOR | Greater Stavanger | 86,158 | +5.0% | Stavanger Airport Sola | |
| 9. | DEN | East Jutland metropolitan area | 70,689 | -10.1% | Billund Airport and Aarhus Airport | |
| 10. | NOR | Trondheim Region | 60,987 | +5.3% | Trondheim Airport Værnes |
Freight and mail tonnes edit
Note: The statistics below are provided in metric tonnes with three decimal digits, i.e. with an accuracy of number of kilograms handled at each airport. The statistics do not include belly cargo transported on regular or charter passenger flights.
Busiest air routes edit
Included below are statistics for the busiest air routes in terms of total passengers on board. When air traffic exists to/from or between secondary airports for a city/region, the secondary airports are included in the statistics below according to the footnotes. The main airport is defined as the airport handling the highest number of passengers for each city/region.
Busiest intra-Nordic air routes edit
These statistics include total passengers on-board between and within the Nordic countries.[20]
| Rank | Country 1 | City 1 | Country 2 | City 2 | Passengers (2012) | Passengers (2016) | Passengers (2019) |
|---|---|---|---|---|---|---|---|
| 1. | NOR | Oslo1 | NOR | Trondheim | 2,039,184 | 2,119,844 | 2,206,801 |
| 2. | NOR | Oslo1 | NOR | Bergen | 1,991,095 | 2,037,755 | 2,165,482 |
| 3. | NOR | Oslo2 | NOR | Stavanger | 1,620,606 | 1,648,488 | 1,761,646 |
| 4. | DEN | Copenhagen | NOR | Oslo2 | 1,410,384 | 1,506,326 | 1,540,240 |
| 5. | NOR | Oslo | SWE | Stockholm | 1,200,562 | 1,399,211 | 1,408,504 |
| 6. | DEN | Copenhagen4 | SWE | Stockholm3 | 1,309,198 | 1,555,615 | 1,390,123 |
| 7. | SWE | Stockholm3 | FIN | Helsinki | 1,029,827 | 1,275,468 | 1,379,068 |
| 8. | NOR | Oslo | NOR | Tromsø | 1,033,295 | 1,178,371 | 1,242,962 |
| 9. | SWE | Stockholm3 | SWE | Gothenburg | 1,270,234 | 1,332,597 | 1,129,552 |
| 10. | SWE | Stockholm | SWE | Luleå | 984,869 | 1,068,051 | 1,046,100 |
| 11. | SWE | Stockholm3 | SWE | Malmö4 | 1,191,531 | 1,209,688 | 1,023,136 |
| 12. | FIN | Helsinki | FIN | Oulu | 885,062 | 949,143 | 956,641 |
| 13. | SWE | Stockholm3 | SWE | Umeå | 916,533 | 957,840 | 860,500 |
| 14. | DEN | Copenhagen | FIN | Helsinki | 777,804 | 792,299 | 852,741 |
| 15. | NOR | Oslo | NOR | Bodø | 737,703 | 809,484 | 837,623 |
| 16. | DEN | Copenhagen | DEN | Aalborg | 919,302 | 890,706 | 782,275 |
| 17. | NOR | Oslo | NOR | Ålesund | 605,261 | 606,046 | 654,853 |
| 18. | NOR | Oslo | NOR | Harstad/Narvik | 521,645 | 579,286 | 604,761 |
| 19. | FIN | Helsinki | FIN | Rovaniemi | 345,496 | 396,897 | 543,660 |
| 20. | DEN | Copenhagen | ISL | Keflavík/Reykjavík | 379,302 | 534,285 | 531,975 |
| 21. | NOR | Bergen | NOR | Stavanger | 732,115 | 560,686 | 513,845 |
| 22. | NOR | Oslo | FIN | Helsinki | 341,761 | 406,888 | 513,127 |
| 23. | NOR | Oslo | NOR | Kristiansand S. | 485,799 | 510,597 | 510,077 |
| 24. | NOR | Oslo | NOR | Haugesund | 424,181 | 450,732 | 474,092 |
| 25. | DEN | Copenhagen | NOR | Bergen | 382,375 | 483,949 | 434,841 |
| 26. | SWE | Stockholm3 | SWE | Östersund/Åre | 336,108 | 470,704 | 429,612 |
| 27. | SWE | Stockholm3 | SWE | Helsingborg/Ängelholm4 | 384,640 | 402,377 | 376,367 |
| 28. | SWE | Stockholm3 | SWE | Visby | ? | 381,610 | 375,468 |
| 29. | NOR | Oslo | NOR | Molde | 342,331 | 371,564 | 354,012 |
| 30. | NOR | Bergen | NOR | Trondheim | 488,915 | 410,029 | 345,612 |
1 Includes Oslo Airport, Moss Airport Rygge and Torp Sandefjord Airport
2 Includes Oslo Airport and Torp Sandefjord Airport
3 Includes Stockholm Arlanda Airport and Bromma Stockholm Airport
4 In these statistics Malmö and Helsingborg/Ängelholm are separated from Copenhagen/Roskilde. When these airports in the Øresund region are considered together, flights between this region and Stockholm carried 2,885,369 passengers in 2012 and 2,789,626 in 2019, making this the busiest intra-Nordic air corridor.
Busiest intra-European Union air routes edit
These statistics[20] include total passenger on-board between the Nordic countries and other countries within the European Union and member states of the European Free Trade Association. At the time these values refer to, the United Kingdom was part of the European Union, and is therefore still listed here.
| Rank | Country 1 | City 1 | Country 2 | City 2 | Passengers (2012) | Passengers (2016) | Passengers (2019) |
|---|---|---|---|---|---|---|---|
| 1. | DEN | Copenhagen | GBR | London1 | 1,637,520 | 2,500,567 | 2,214,177 |
| 2. | SWE | Stockholm2 | GBR | London1 | 1,532,962 | 1,809,061 | 1,610,929 |
| 3. | NOR | Oslo3 | GBR | London1 | 1,297,192 | 1,319,675 | 1,434,256 |
| 4. | DEN | Copenhagen | NLD | Amsterdam | 822,858 | 974,986 | 1,109,796 |
| 5. | FIN | Helsinki | GBR | London8 | 646,175 | 897,408 | 1,047,095 |
| 6. | DEN | Copenhagen | FRA | Paris4 | 845,000 | 928,240 | 886,836 |
| 7. | SWE | Stockholm | NLD | Amsterdam | 630,806 | 780,689 | 863,616 |
| 8. | ISL | Reykjavík18 | GBR | London1 | 314,555 | 822,075 | 851,995 |
| 9. | NOR | Oslo5 | NLD | Amsterdam | 720,778 | 798,313 | 829,768 |
| 10. | FIN | Helsinki | NLD | Amsterdam | 463,784 | 560,823 | 738,498 |
| 11. | SWE | Stockholm6 | DEU | Frankfurt7 | 673,818 | 688,138 | 697,945 |
| 12. | SWE | Stockholm6 | FRA | Paris9 | 563,227 | 487,874 | 664,469 |
| 13. | DEN | Copenhagen | DEU | Frankfurt | 644,956 | 662,306 | 663,662 |
| 14. | DEN | Copenhagen | DEU | Berlin11 | 527,191 | 682,020 | 628,470 |
| 15. | FIN | Helsinki | DEU | Munich | 385,880 | 489,650 | 589,107 |
| 16. | SWE | Gothenburg10 | GBR | London1 | 537,202 | 698,074 | 578,776 |
| 17. | FIN | Helsinki | GER | Berlin | 325,766 | 453,427 | 569,767 |
| 18. | SWE | Stockholm6 | DEU | Munich14 | 440,768 | 477,758 | 559,991 |
| 19. | NOR | Oslo3 | DEU | Frankfurt7 | 479,892 | 475,475 | 539,327 |
| 20. | SWE | Stockholm6 | ESP | Malaga | 538,863 | ||
| 21. | FIN | Helsinki | DEU | Frankfurt | 525,857 | 500,358 | 527,928 |
| 22. | DEN | Copenhagen | ESP | Málaga | 202,893 | 503,266 | 523,432 |
| 23. | SWE | Stockholm6 | DEU | Berlin11 | 416,275 | 490,647 | 516,373 |
| 24. | DEN | Copenhagen | CHE | Zürich | 425,176 | 415,046 | 515,266 |
| 25. | DEN | Copenhagen | DEU | Munich | 398,379 | 478,197 | 513,678 |
| 26. | NOR | Oslo12 | FRA | Paris13 | 482,353 | 459,142 | 513,447 |
| 27. | FIN | Helsinki | FRA | Paris | 422,260 | 410,691 | 492,822 |
| 28. | DEN | Copenhagen | BEL | Brussels16 | 481,878 | 636,357 | 478,854 |
| 29. | NOR | Oslo3 | ESP | Alicante | 197,156 | 468,851 | 474,351 |
| 30. | DEN | Copenhagen | AUT | Vienna | 456,143 |
1 Includes London Heathrow Airport, London Gatwick Airport, London Stansted Airport and/or London Luton Airport
2 Includes Stockholm Arlanda Airport, Stockholm Skavsta Airport and Stockholm Västerås Airport
3 Includes Oslo Airport, Moss Airport Rygge and Torp Sandefjord Airport
4 Includes Paris Charles de Gaulle Airport and Paris Orly Airport
5 Includes Oslo Airport and Torp Sandefjord Airport
6 Includes Stockholm Arlanda Airport and Stockholm Skavsta Airport
7 Includes Frankfurt Airport and Frankfurt Hahn Airport
8 Includes London Heathrow Airport and London Gatwick Airport
9 Includes Paris Charles de Gaulle Airport and Paris Beauvais Tillé Airport
10 Includes Göteborg Landvetter Airport, and Göteborg City Airport
11 Includes Berlin Tegel Airport and Berlin Schönefeld Airport
12 Includes Oslo Airport and Moss Airport Rygge
13 Includes Paris Charles de Gaulle Airport, Paris Orly Airport and Paris Beauvais Tillé Airport
14 Includes Munich Airport and Allgäu Airport Memmingen
15 Includes Barcelona–El Prat Airport and Girona–Costa Brava Airport
16 Includes Brussels Airport and Brussels-Charleroi Airport
17 Includes Rome-Fiumicino Airport and Rome-Ciampino Airport
18 Refers to Keflavík Airport
Busiest extra–European Union air routes edit
These statistics[20] include total passengers on board between the Nordic countries and countries outside of the European Union and non-member states of the European Free Trade Association.
| Rank | Country 1 | City 1 | Country 2 | City 2 | Passengers (2012) | Passengers (2016) | Passengers (2019) |
|---|---|---|---|---|---|---|---|
| 1. | SWE | Stockholm | TUR | Istanbul1 | 292,119 | 474,403 | 499,736 |
| 2. | DEN | Copenhagen | TUR | Istanbul1 | 367,859 | 475,497 | 495,425 |
| 3. | FIN | Helsinki | JPN | Tokyo5 | 187,069 | 279,724 | 438,270 |
| 4. | ISL | Reykjavík7 | USA | New York City3 | 191,500 | 398,685 | 433,338 |
| 5. | DEN | Copenhagen | QAT | Doha | 156,492 | 286,886 | 400,021 |
| 6. | FIN | Helsinki | THA | Bangkok | 258,607 | 261,486 | 361,581 |
| 7. | DEN | Copenhagen | USA | New York City3 | 264,687 | 382,313 | 360,078 |
| 8. | FIN | Helsinki | HKG | Hong Kong | 182,121 | 181,809 | 352,038 |
| 9. | FIN | Helsinki | RUS | Moscow6 | 140,829 | 186,535 | 336,507 |
| 10. | DEN | Copenhagen | ARE | Dubai | 204,394 | 319,357 | 330,579 |
| 11. | SWE | Stockholm | ARE | Dubai | 0 | 258,510 | 302,545 |
| 12. | SWE | Stockholm | QAT | Doha | 153,059 | 224,012 | 284,259 |
| 13. | SWE | Stockholm | USA | New York City3 | 248,157 | 334,838 | 279,117 |
| 14. | NOR | Oslo | USA | New York City3 | 241,577 | 306,257 | 276,700 |
| 15. | SWE | Stockholm | THA | Bangkok | 227,198 | 269,933 | 264,007 |
| 16. | DEN | Copenhagen | THA | Bangkok | 372,069 | 265,549 | 261,593 |
| 17. | FIN | Helsinki | CHN | Shanghai | 146,788 | 162,956 | 244,416 |
| 18. | FIN | Helsinki | QAT | Doha | 0 | 0 | 233,846 |
| 19. | ISL | Reykjavík7 | USA | Boston | 147,700 | 339,691 | 233,669 |
| 20. | NOR | Oslo | THA | Bangkok | 145,744 | 234,737 | 229,212 |
| 21. | FIN | Helsinki | JPN | Osaka | 140,688 | 148,715 | 223,869 |
| 22. | FIN | Helsinki | KOR | Seoul | 122,579 | 176,273 | 214,982 |
| 23. | FIN | Helsinki | RUS | Saint Petersburg | 106,794 | ? | 210,179 |
| 24. | ISL | Reykjavík7 | CAN | Toronto | 45,900 | 214,105 | 209,201 |
| 25. | NOR | Oslo | QAT | Doha | 0 | 147,430 | 202,347 |
| 26. | FIN | Helsinki | SIN | Singapore | 157,754 | 144,491 | 196,941 |
| 27. | NOR | Oslo | ARE | Dubai | 0 | 163,920 | 194,994 |
| 28. | DEN | Copenhagen | CHN | Beijing | 139,075 | 136,891 | 189,228 |
| 29. | DEN | Copenhagen | TUR | Antalya | 182,108 | 154,083 | 185,912 |
| 30. | FIN | Helsinki | USA | New York City | 173,877 | 165,721 | 180,585 |
1 Includes the new Istanbul Airport, Istanbul Atatürk Airport and Istanbul Sabiha Gökçen International Airport
2 Includes Oslo Airport and Torp Sandefjord Airport
3 Includes John F. Kennedy International Airport and Newark Liberty International Airport
4 Includes Newark Liberty International Airport
5 Includes Narita International Airport
6 Includes Sheremetyevo International Airport
7 Includes Keflavík International Airport
8 Includes Washington-Dulles and Baltimore-Washington airports
Gallery edit
 Copenhagen Airport, aerial view
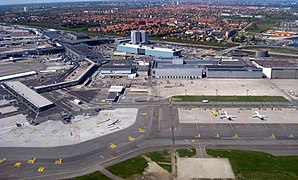 Copenhagen Airport, terminal and main hangar area with new low-cost terminal to the left
 Copenhagen Airport, non-schengen border control at pier C
 Oslo Airport, domestic concourse
 Oslo Airport, entrance to domestic area
 Oslo Airport, check-in area
 Stockholm Arlanda Airport, aerial view from the north
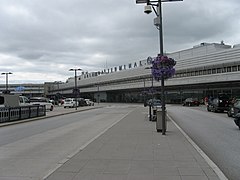 Stockholm Arlanda Airport, terminal 5
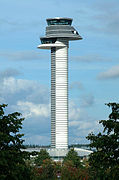 Stockholm Arlanda Airport, control tower
 Helsinki Airport, aerial view from the east
 Helsinki Airport, aerial view from runway 33
 Helsinki Airport, apron view
 Bergen Airport Flesland, terminal view
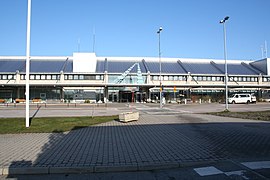 Göteborg Landvetter Airport, terminal entrance
 Stavanger Airport Sola, terminal
 Trondheim Airport Værnes, terminal
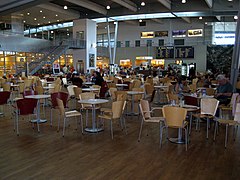 Billund Airport, Capella Bar in terminal
 Stockholm Skavsta Airport, terminal entrance
 Stockholm Bromma Airport, terminal entrance
 Keflavík International Airport, aerial view of terminal
 Malmö Airport, terminal from domestic side
 Tromsø Airport Langnes, aerial view
 Bodø Airport, aerial view
 Moss Airport Rygge, terminal
 Aalborg Airport, terminal entrance
 Torp Sandefjord Airport, aerial view
 Luleå Airport, terminal entrance
 Oulu Airport, terminal overview
 Umeå City Airport, terminal entrance
 Kristiansand Airport Kjevik, apron view
 Ålesund Airport Vigra, terminal entrance
 Göteborg City Airport, taxi line at terminal
 Tampere-Pirkkala Airport, terminal overview
 Haugesund Airport Karmøy, parking at terminal
 Harstad/Narvik Airport Evenes, terminal at Gate 30
 Aarhus Airport, terminal
 Molde Airport Årø, terminal in background
 Reykjavík Airport, aerial view
 Rovaniemi Airport, terminal
 Ängelholm-Helsingborg Airport, terminal view from air aide
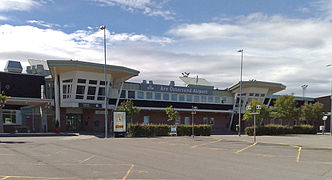 Åre Östersund Airport Airport, terminal view
 Turku Airport, terminal check-in area
 Kristiansund Airport Kvernberget, aerial view
 Alta Airport, terminal
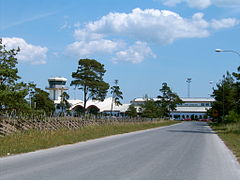 Visby Airport, road to terminal
 Vaasa Airport, terminal land side
 Kirkenes Airport Høybuktmoen, terminal air side
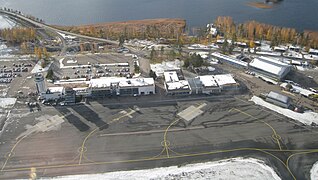 Kuopio Airport, apron and terminal
 Sundsvall-Härnösand Airport, terminal land side
 Skellefteå Airport, terminal and ATC-tower land side
 Kittilä Airport, terminal and ATC-tower air side
 Bornholm Airport, terminal and ATC-tower air side
 Ronneby Airport, terminal land side
 Vágar Airport, service buildings adjacent to apron
 Bardufoss Airport, runway and approach lights
 Växjö Småland Airport, terminal land side
 Kalmar Airport, terminal land side
 Kiruna Airport, terminal land side
 Brønnøysund Airport Brønnøy, inside terminal
 Stockholm Västerås Airport, terminal land side
 Hammerfest Airport, airport overview
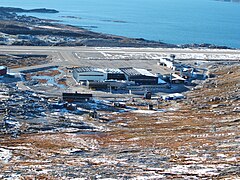 Nuuk Airport, terminal and runway

.JPG)


.JPG)


.jpg)


See also edit
- List of the busiest airports in Europe
- List of busiest airports by passenger traffic
- List of busiest passenger air routes
References edit
- ^ a b c Avinor AS
- ^ a b c d Isavia Ltd
- ^ a b c Danish Transport Authority (only available in Danish)
- ^ a b c Swedish Transport Agency (only available in Swedish)
- ^ a b c Passasjerstatistikk
- ^ a b c OM OSS PASSASJERSTATISTIKK
- ^ Database tables - Statistics Finland
- ^ a b ANNUAL AVIATION FACT FILE
- ^ Database tables - Statistics Finland
- ^ Positiv trafikkutvikling på Stord lufthamn i 2021
- ^ a b c "Årsrapport" (in Danish). Greenland airport administration. Retrieved 2024-01-21.
- ^ Positiv trafikkutvikling på Stord lufthamn i 2021
- ^ Statistics Finland’s free-of-charge statistical databases
- ^ Dramatisk fall i trafikken i 2020 på TORP
- ^ 16.124 personar reiste over Stord lufthamn i 2020
- ^ Nesten 2,1 millioner reisende på Torp i 2019
- ^ a b The only domestic route is to Akureyri with 5 weekly flights per direction using a 74-seat Q400 aircraft. This means around 25000 domestic passengers.
- ^ Årsregnskab See 2016 page 12.
- ^ a b c Eurostat>Transport>Data>Database Search the "avia_par_dk", "avia_par_no" etc datasets (accessed Oct 2021)