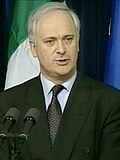
The 1999 European Parliament election in Ireland was the Irish component of the 1999 European Parliament election . The election was conducted under the single transferable vote .
1999 European Parliament election in Ireland Turnout 1,438,287 (50.2% pp ) First party Second party Third party Green
Leader Bertie Ahern John Bruton None Party Fianna Fáil Fine Gael Green Alliance UEN EPP–ED Greens/EFA Leader since 19 December 1994 20 November 1990 6 November 2001 Last election 35.0%, 7 seats 24.3%, 4 seats 7.9%, 2 seats Seats won Seat change Popular vote 537,757 342,171 93,100 Percentage 38.6 24.6% 6.7% Swing Fourth party Fifth party Sixth party Leader None[a] Ruairi Quinn Gerry Adams Party Independent Labour Sinn Féin Alliance ELDR & EPP-ED PES Leader since 13 November 1997 1983 Last election 1 seat 11.0%, 1 seat 3.0%, 0 seats Seats won Seat change Popular vote 198,386 121,542 88,165 Percentage 14.3% 8.7% 6.3% Swing
MEPs elected edit Voting details edit 1979–2004 European Parliament Ireland constituencies Constituency Electorate Turnout Spoilt Valid Poll Quota Seats Candidates Connacht–Ulster 541,552 332,236 (61.3%) 12,085 (3.6%) 320,151 80,038 3 11 Dublin 793,200 286,684 (36.1%) 6,013 (2.1%) 280,671 56,135 4 13 Leinster 706,200 357,064 (50.5%) 14,725 (4.1%) 342,339 68,468 4 8 Munster 823,008 462,303 (56.2%) 13,724 (2.9%) 448,579 89,716 4 10 Total 2,864,361 1,438,287 (50.2%) 46,547 (3.2%) 1,391,740 — 15 42
See also edit External links edit ^ Pictured here is Pat Cox , one of two successful Independent candidates in this election. Cox would become leader of the ELDR group in the European parliament between 1998 and 2002. References edit 


