General elections were held in Sweden on 18 September 1988.[1] The Swedish Social Democratic Party remained the largest party in the Riksdag, winning 156 of the 349 seats.[2]
| |||||||||||||||||||||||||||||||||||||||||||||||||||||||||||||||||||||||||||||
All 349 seats in the Riksdag 175 seats needed for a majority | |||||||||||||||||||||||||||||||||||||||||||||||||||||||||||||||||||||||||||||
|---|---|---|---|---|---|---|---|---|---|---|---|---|---|---|---|---|---|---|---|---|---|---|---|---|---|---|---|---|---|---|---|---|---|---|---|---|---|---|---|---|---|---|---|---|---|---|---|---|---|---|---|---|---|---|---|---|---|---|---|---|---|---|---|---|---|---|---|---|---|---|---|---|---|---|---|---|---|
| |||||||||||||||||||||||||||||||||||||||||||||||||||||||||||||||||||||||||||||
 Map of the election, showing the distribution of constituency and levelling seats, as well as the largest political bloc within each constituency. | |||||||||||||||||||||||||||||||||||||||||||||||||||||||||||||||||||||||||||||
| |||||||||||||||||||||||||||||||||||||||||||||||||||||||||||||||||||||||||||||


.jpg)

Debates edit
| 1988 Swedish general election debates | |||||||||
|---|---|---|---|---|---|---|---|---|---|
| Date | Time | Organizers | Moderators | P Present I Invitee N Non-invitee | |||||
| S | M | L | C | V | Refs | ||||
| Sveriges Television | Gösta Spjuth [sv] | P Ingvar Carlsson,Kjell-Olof Feldt | P Carl Bildt | P Bengt Westerber | P Olof Johansson | P Lars Werner | [3] | ||
Results edit
 | |||||
|---|---|---|---|---|---|
| Party | Votes | % | Seats | +/– | |
| Swedish Social Democratic Party | 2,321,826 | 43.21 | 156 | –3 | |
| Moderate Party | 983,226 | 18.30 | 66 | –10 | |
| People's Party | 655,720 | 12.20 | 44 | –7 | |
| Centre Party | 607,240 | 11.30 | 42 | –1 | |
| Left Party Communists | 314,031 | 5.84 | 21 | +2 | |
| Green Party | 296,935 | 5.53 | 20 | +20 | |
| Christian Democratic Society Party | 158,182 | 2.94 | 0 | –1 | |
| Other parties | 36,559 | 0.68 | 0 | 0 | |
| Total | 5,373,719 | 100.00 | 349 | 0 | |
| Valid votes | 5,373,719 | 98.76 | |||
| Invalid/blank votes | 67,331 | 1.24 | |||
| Total votes | 5,441,050 | 100.00 | |||
| Registered voters/turnout | 6,330,023 | 85.96 | |||
| Source: Nohlen & Stöver | |||||
Seat distribution edit
| Constituency | Total seats | Seats won | |||||||||
|---|---|---|---|---|---|---|---|---|---|---|---|
| By party | By coalition | ||||||||||
| S | M | F | C | V | MP | Left | Right | Others | |||
| Älvsborg North | 11 | 4 | 2 | 2 | 2 | 1 | 4 | 6 | 1 | ||
| Älvsborg South | 6 | 3 | 1 | 1 | 1 | 3 | 3 | ||||
| Blekinge | 6 | 4 | 1 | 1 | 4 | 2 | |||||
| Bohus | 12 | 5 | 2 | 2 | 1 | 1 | 1 | 6 | 5 | 1 | |
| Fyrstadskretsen | 20 | 9 | 5 | 2 | 1 | 1 | 2 | 10 | 8 | 2 | |
| Gävleborg | 12 | 6 | 1 | 1 | 2 | 1 | 1 | 7 | 4 | 1 | |
| Gothenburg | 19 | 7 | 4 | 3 | 1 | 2 | 2 | 9 | 8 | 2 | |
| Gotland | 2 | 1 | 1 | 1 | 1 | ||||||
| Halland | 11 | 4 | 2 | 2 | 2 | 1 | 4 | 6 | 1 | ||
| Jämtland | 5 | 3 | 1 | 1 | 3 | 2 | |||||
| Jönköping | 11 | 5 | 2 | 2 | 2 | 5 | 6 | ||||
| Kalmar | 10 | 5 | 2 | 1 | 2 | 5 | 5 | ||||
| Kopparberg | 12 | 6 | 1 | 1 | 2 | 1 | 1 | 7 | 4 | 1 | |
| Kristianstad | 12 | 5 | 3 | 1 | 2 | 1 | 5 | 6 | 1 | ||
| Kronoberg | 6 | 3 | 1 | 1 | 1 | 3 | 3 | ||||
| Malmöhus | 13 | 6 | 3 | 1 | 2 | 1 | 6 | 6 | 1 | ||
| Norrbotten | 10 | 6 | 1 | 1 | 1 | 1 | 7 | 3 | |||
| Örebro | 11 | 6 | 1 | 2 | 1 | 1 | 7 | 4 | |||
| Östergötland | 17 | 8 | 3 | 2 | 2 | 1 | 1 | 9 | 7 | 1 | |
| Skaraborg | 11 | 5 | 2 | 1 | 2 | 1 | 5 | 5 | 1 | ||
| Södermanland | 9 | 5 | 2 | 1 | 1 | 5 | 4 | ||||
| Stockholm County | 37 | 13 | 10 | 6 | 2 | 3 | 3 | 16 | 18 | 3 | |
| Stockholm Municipality | 30 | 10 | 8 | 5 | 1 | 4 | 2 | 14 | 14 | 2 | |
| Uppsala | 12 | 5 | 2 | 2 | 1 | 1 | 1 | 6 | 5 | 1 | |
| Värmland | 12 | 6 | 2 | 1 | 2 | 1 | 7 | 5 | |||
| Västerbotten | 10 | 5 | 1 | 1 | 2 | 1 | 6 | 4 | |||
| Västernorrland | 12 | 6 | 1 | 1 | 2 | 1 | 1 | 7 | 4 | 1 | |
| Västmanland | 10 | 5 | 2 | 1 | 1 | 1 | 6 | 4 | |||
| Total | 349 | 156 | 66 | 44 | 42 | 21 | 20 | 177 | 152 | 20 | |
| Source: Statistics Sweden | |||||||||||
By municipality edit
 Votes by municipality. The municipalities are the color of the party that got the most votes within the coalition that won relative majority.
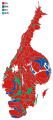 Cartogram of the map to the left with each municipality rescaled to the number of valid votes cast.
 Map showing the voting shifts from the 1985 to the 1988 election. Darker blue indicates a municipality voted more towards the parties that formed the centre-right bloc. Darker red indicates a municipality voted more towards the parties that form the left-wing bloc.
 Votes by municipality as a scale from red/Left-wing bloc to blue/Centre-right bloc.
 Cartogram of vote with each municipality rescaled in proportion to number of valid votes cast. Deeper blue represents a relative majority for the centre-right coalition, brighter red represents a relative majority for the left-wing coalition.


References edit
- ^ Nohlen, D & Stöver, P (2010) Elections in Europe: A data handbook, p1858 ISBN 978-3-8329-5609-7
- ^ Nohlen & Stöver, p1873
- ^ Sweden, Sveriges Television AB, Stockholm, Slutdebatter – Val-88: Riksdagspartiernas slutdebatt (in Swedish), retrieved 2024-02-01
{{citation}}: CS1 maint: multiple names: authors list (link)
🔥 Top keywords: Akademia e Shkencave e RPS te ShqiperiseAlexandria Ocasio-CortezBilderberg GroupCristiano RonaldoDong XiaowanMinecraftOperation GladioPrimal cutRiot FestStrictly Come Dancing (series 7)Main PageSpecial:SearchWikipedia:Featured picturesAdemola LookmanCleopatraDeaths in 2024Pine Tree Flag2024 Indian general electionYouTubeFuriosa: A Mad Max SagaCharlie ColinCarlo AcutisAccordionSurvivor 46ChilaquilesScott PorterBridgertonKyrie IrvingLuka DončićXXXTentacionAtalanta BCTrain (band)Terrence HowardKepler's SupernovaAnthony Edwards (basketball)Kieran McKennaAnya Taylor-JoyEbrahim RaisiOsteo-odonto-keratoprosthesisChelsea Manalo2024 United Kingdom general electionXXX (film series)Vanessa HudgensList of Bridgerton charactersThe Fall Guy (2024 film)HeeramandiPortal:Current eventsXXX: Return of Xander CageNicola Coughlan