Oxford West and Abingdon (UK Parliament constituency)
Oxford West and Abingdon is a constituency[n 1] represented in the House of Commons of the UK Parliament since 2017 by Layla Moran, a Liberal Democrat.[n 2]
| Oxford West and Abingdon | |
|---|---|
| County constituency for the House of Commons | |
 Boundaries since 2024 | |
 Boundary of Oxford West and Abingdon in South East England | |
| County | Oxfordshire |
| Electorate | 72,004 (2023) [1] |
| Major settlements |
|
| Current constituency | |
| Created | 1983 |
| Member of Parliament | TBC (TBC) |
| Seats | One |
| Created from | |
Constituency profile
editThe constituency includes the town of Abingdon, the village of Kidlington, and the western and northern parts of the city of Oxford, and some of the colleges of the University of Oxford. At the end of 2010, unemployment was the fifth lowest of the 84 South East constituencies, at 1.2% compared to a mean of 2.45%.[2] The area has rapid transit connections to London, Reading and the commercial heart of Oxford, has large business and research parks and a choice of two major railway stations, Oxford and Didcot Parkway.
History
editCreation
editThe seat was created in 1983 as part of the reconfiguration of those in the county to avoid malapportionment, abolishing Oxford as a seat. It merged about half the city with the eastern portion of the former Abingdon seat.
MPs
editConservative John Patten (MP for Oxford in the 1979–1983 Parliament), held the seat from its creation until he retired in 1997. The seat was gained by Liberal Democrat, Evan Harris, who held the seat for thirteen years until the 2010 general election, when the Conservative Nicola Blackwood retook the seat in one of the most marginal results of that election. Blackwood held the seat until the 2017 general election, when she was defeated by Liberal Democrat Layla Moran in another marginal result. Moran retained the seat at the 2019 general election with a much increased majority of 15.2%.
Contests
editThe seat has been contested nine times, each of them general elections. At each contest, the Labour party candidate has polled third, with the peak share of votes to date being 20.2% in 1997. The strongest victory, in share of the vote, was that of Harris of the Liberal Democrats in 2001, a 17.8% majority (in a seven-way contest).
The Green Party and its predecessor, the Ecology Party, stood in the first eight contests, in each losing the deposit paid.
In December 2023, the Labour Party included the seat in its published list of 211 non-battleground seats, suggesting they did not see it as winnable.[3]
Boundaries and boundary changes
edit1983–1997
edit- The District of Vale of White Horse wards of Abbey, Caldecott, Cumnor, Fitzharris, Hinksey, Kennington, Northcourt, Ock, Radley, St Helen Without, and Sunningwell and Wootton; and
- The City of Oxford wards of Central, Cherwell, North, South, West, and Wolvercote.[4]
The majority of the new constituency, comprising the town of Abingdon-on-Thames and areas to the west of Oxford, was previously part of the abolished constituency of Abingdon in Berkshire. The City of Oxford wards had previously been in the abolished constituency of Oxford.
1997–2010
edit- The District of Vale of White Horse wards of Abbey, Caldecott, Cumnor, Fitzharris, Hinksey, Kennington, Northcourt, Ock, Radley, St Helen Without, and Sunningwell and Wootton;
- The City of Oxford wards of Central, Cherwell, North, West, and Wolvercote; and
- The District of Cherwell wards of Gosford, North West Kidlington, and South East Kidlington.[5]
Kidlington was transferred from Witney. The South ward of the City of Oxford was transferred to Oxford East.
2010-2024
edit
- The District of Vale of White Horse wards of Abingdon Abbey and Barton, Abingdon Caldecott, Abingdon Dunmore, Abingdon Fitzharris, Abingdon Northcourt, Abingdon Ock Meadow, Abingdon Peachcroft, Appleton and Cumnor, Kennington and South Hinksey, North Hinksey and Wytham, Radley, and Sunningwell and Wootton;
- The City of Oxford wards of Jericho and Osney, North, St Margaret's, Summertown, and Wolvercote; and
- The District of Cherwell wards of Kidlington North, Kidlington South, and Yarnton, Gosford and Water Eaton.[6]
Further loss to Oxford East, including the city centre, following revision of City of Oxford wards; marginal realignment of boundary with Wantage; Yarnton transferred from Witney.
Since 2024
editFurther to the 2023 Periodic Review of Westminster constituencies, enacted by the Parliamentary Constituencies Order 2023, from the 2024 general election the constituency composed of the following (as they existed on 1 December 2020):
- The following wards of the City of Oxford wards of: Carfax & Jericho; Cutteslowe & Sunnymead; Holywell; Osney & St. Thomas; Summertown; Walton Manor; Wolvercote.
- The District of Vale of White Horse wards of: Abingdon Abbey Northcourt; Abingdon Caldecott; Abingdon Dunmore; Abingdon Fitzharris; Abingdon Peachcroft; Botley & Sunningwell; Cumnor; Kennington & Radley; Marcham; Wootton.[7]
The electorate will be reduced to bring it within the permitted range by transferring Kidlington to the newly created constituency of Bicester and Woodstock. To partly compensate, Oxford city centre and University colleges will be moved back in from Oxford East. In addition, the village of Marcham will be transferred from Wantage.
Members of Parliament
edit| Election | Member[8][9] | Party | |
|---|---|---|---|
| 1983 | John Patten | Conservative | |
| 1997 | Evan Harris | Liberal Democrats | |
| 2010 | Nicola Blackwood | Conservative | |
| 2017 | Layla Moran | Liberal Democrats | |
Elections
edit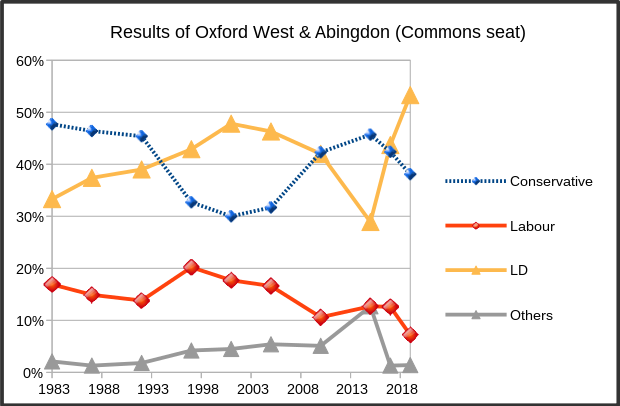 Election results for Oxford West and Abingdon

Elections in the 2020s
edit| Party | Candidate | Votes | % | ±% | |
|---|---|---|---|---|---|
| SDP | Anni Byard | ||||
| Green | Chris Goodall | ||||
| Reform UK | James Gunn | ||||
| Liberal Democrats | Layla Moran | ||||
| Independent | Josh Phillips | ||||
| Conservative | Vinay Raniga | ||||
| CPA | Ian Shelley | ||||
| Labour | Stephen Webb | ||||
| Majority | |||||
| Turnout | |||||
Elections in the 2010s
edit| Party | Candidate | Votes | % | ±% | |
|---|---|---|---|---|---|
| Liberal Democrats | Layla Moran | 31,340 | 53.3 | ||
| Conservative | James Fredrickson | 22,397 | 38.1 | ||
| Labour | Rosie Sourbut | 4,258 | 7.2 | ||
| Brexit Party | Allison Wild | 829 | 1.4 | New | |
| Majority | 8,943 | 15.2 | |||
| Turnout | 58,824 | 76.4 | |||
| Liberal Democrats hold | Swing | ||||
| Party | Candidate | Votes | % | ±% | |
|---|---|---|---|---|---|
| Liberal Democrats | Layla Moran | 26,256 | 43.7 | ||
| Conservative | Nicola Blackwood | 25,440 | 42.4 | ||
| Labour | Marie Tidball | 7,573 | 12.6 | ||
| UKIP | Alan Harris | 751 | 1.3 | ||
| Majority | 816 | 1.3 | N/A | ||
| Turnout | 60,020 | 79.6 | |||
| Liberal Democrats gain from Conservative | Swing | ||||
| Party | Candidate | Votes | % | ±% | |
|---|---|---|---|---|---|
| Conservative | Nicola Blackwood | 26,153 | 45.7 | ||
| Liberal Democrats | Layla Moran | 16,571 | 28.9 | ||
| Labour | Sally Copley | 7,274 | 12.7 | ||
| UKIP | Alan Harris | 3,963 | 6.9 | ||
| Green | Larry Sanders | 2,497 | 4.4 | ||
| NHA | Helen Salisbury | 723 | 1.3 | New | |
| Socialist (GB) | Mike Foster | 66 | 0.1 | New | |
| Majority | 9,582 | 16.7 | |||
| Turnout | 57,247 | 75.2 | |||
| Conservative hold | Swing | ||||

| Party | Candidate | Votes | % | ±% | |
|---|---|---|---|---|---|
| Conservative | Nicola Blackwood | 23,906 | 42.3 | ||
| Liberal Democrats | Evan Harris | 23,730 | 42.0 | ||
| Labour | Richard Stevens | 5,999 | 10.6 | ||
| UKIP | Paul Williams | 1,518 | 2.7 | ||
| Green | Chris Goodall | 1,184 | 2.1 | ||
| Animal Protection | Keith Mann | 143 | 0.3 | New | |
| Majority | 176 | 0.3 | N/A | ||
| Turnout | 56,480 | 70.2 | |||
| Conservative gain from Liberal Democrats | Swing | ||||
Elections in the 2000s
edit
| Party | Candidate | Votes | % | ±% | |
|---|---|---|---|---|---|
| Liberal Democrats | Evan Harris | 24,336 | 46.3 | −1.5 | |
| Conservative | Amanda McLean | 16,653 | 31.7 | +1.7 | |
| Labour | Antonia Bance | 8,725 | 16.6 | −1.1 | |
| Green | Tom Lines | 2,091 | 4.0 | +1.2 | |
| UKIP | Marcus Watney | 795 | 1.5 | +0.6 | |
| Majority | 7,683 | 14.6 | -3.2 | ||
| Turnout | 52,600 | 65.6 | +1.1 | ||
| Liberal Democrats hold | Swing | −1.6 | |||
| Party | Candidate | Votes | % | ±% | |
|---|---|---|---|---|---|
| Liberal Democrats | Evan Harris | 24,670 | 47.8 | +4.9 | |
| Conservative | Ed Matts | 15,485 | 30.0 | −2.7 | |
| Labour | Gillian Kirk | 9,114 | 17.7 | −2.5 | |
| Green | Mike Woodin | 1,423 | 2.8 | +1.7 | |
| UKIP | Marcus Watney | 451 | 0.9 | +0.5 | |
| Independent | Sigrid Shreeve | 332 | 0.6 | New | |
| Extinction Club | Robert Twigger | 93 | 0.2 | New | |
| Majority | 9,185 | 17.8 | +7.6 | ||
| Turnout | 51,568 | 64.5 | −13.5 | ||
| Liberal Democrats hold | Swing | +3.8 | |||
Elections in the 1990s
edit| Party | Candidate | Votes | % | ±% | |
|---|---|---|---|---|---|
| Liberal Democrats | Evan Harris | 26,268 | 42.9 | +7.1 | |
| Conservative | Laurence Harris | 19,983 | 32.7 | −13.6 | |
| Labour | Susan Brown | 12,361 | 20.2 | +4.1 | |
| Referendum | Gillian Eustace | 1,258 | 2.1 | New | |
| Green | Mike Woodin | 691 | 1.1 | −0.1 | |
| UKIP | Rodney Buckton | 258 | 0.4 | New | |
| ProLife Alliance | Linda Hodge | 238 | 0.4 | New | |
| Natural Law | Anne Wilson | 91 | 0.1 | 0.0 | |
| Local Government | John Rose | 48 | 0.1 | New | |
| Majority | 6,285 | 10.2 | +3.8 | ||
| Turnout | 61,196 | 78.0 | +1.3 | ||
| Liberal Democrats gain from Conservative | Swing | +10.4 | |||
| Party | Candidate | Votes | % | ±% | |
|---|---|---|---|---|---|
| Conservative | John Patten | 25,163 | 45.4 | −1.0 | |
| Liberal Democrats | William Goodhart | 21,624 | 39.0 | +1.6 | |
| Labour | Bruce Kent | 7,652 | 13.8 | −1.1 | |
| Green | Mike Woodin | 660 | 1.2 | −0.1 | |
| Liberal | Roger Jenking | 194 | 0.3 | New | |
| Anti-Federalist League | Susan Nelson | 98 | 0.2 | New | |
| Natural Law | Geoffrey Wells | 75 | 0.1 | New | |
| Majority | 3,539 | 6.4 | -2.6 | ||
| Turnout | 55,466 | 76.7 | −1.7 | ||
| Conservative hold | Swing | −1.3 | |||
Elections in the 1980s
edit| Party | Candidate | Votes | % | ±% | |
|---|---|---|---|---|---|
| Conservative | John Patten | 25,171 | 46.4 | −1.3 | |
| SDP | Chris Huhne | 20,293 | 37.4 | +4.1 | |
| Labour | John Power | 8,108 | 14.9 | −2.0 | |
| Green | Donald Smith | 695 | 1.3 | +0.2 | |
| Majority | 4,878 | 9.0 | -5.4 | ||
| Turnout | 54,267 | 78.4 | +4.4 | ||
| Conservative hold | Swing | −2.7 | |||
| Party | Candidate | Votes | % | ±% | |
|---|---|---|---|---|---|
| Conservative | John Patten | 23,778 | 47.7 | ||
| SDP | Evan Luard | 16,627 | 33.3 | ||
| Labour | Julian Jacottet | 8,440 | 16.9 | ||
| Ecology | Suzette Starmer | 544 | 1.1 | ||
| Monster Raving Loony | Robert Jones | 267 | 0.5 | ||
| Independent | Christopher Smith | 95 | 0.2 | ||
| Independent | Peter Doubleday | 86 | 0.2 | ||
| Independent | Ruth Pinder | 26 | 0.1 | ||
| Majority | 7,151 | 14.4 | |||
| Turnout | 49,863 | 74.0 | |||
| Conservative win (new seat) | |||||
Neighbouring constituencies
editSee also
editNotes
edit- ^ A county constituency (for the purposes of election expenses and type of returning officer).
- ^ As with all UK Parliament constituencies, the constituency elects one Member of Parliament (MP) by the first past the post system of election at least every five years.
References
edit- ^ "The 2023 Review of Parliamentary Constituency Boundaries in England – Volume two: Constituency names, designations and composition – South East". Boundary Commission for England. Retrieved 12 June 2024.
- ^ Unemployment claimants by constituency The Guardian
- ^ Belger, Tom (8 December 2023). "Labour selections: Full list of 211 'non-battleground' seats now open to applications". labourlist.org. Archived from the original on 9 December 2023. Retrieved 3 January 2024.
- ^ "The Parliamentary Constituencies (England) Order 1983". www.legislation.gov.uk. Retrieved 13 February 2019.
- ^ "The Parliamentary Constituencies (England) Order 1995". www.legislation.gov.uk. Retrieved 13 February 2019.
- ^ "The Parliamentary Constituencies (England) Order 2007". www.legislation.gov.uk. Retrieved 13 February 2019.
- ^ "The Parliamentary Constituencies Order 2023". Schedule 1 Part 6 South East region.
- ^ Leigh Rayment's Historical List of MPs – Constituencies beginning with "O"
- ^ "Oxford West & Abingdon parliamentary constituency - Election 2017". BBC News. Retrieved 26 June 2017.
- ^ Stone, Mark (7 June 2024). "Election of a Member of Parliament for Oxford West and Abingdon Constituency" (PDF). Retrieved 7 June 2024 – via Vale of White Horse District Council.
- ^ "Oxford West & Abingdon Parliamentary constituency". BBC News. BBC. Retrieved 27 November 2019.
- ^ "GENERAL ELECTION: List of Oxfordshire parliamentary candidates published". The Oxford Times.
- ^ "South Live: Thursday 11 May". BBC News.
- ^ "Election Data 2015". Electoral Calculus. Archived from the original on 17 October 2015. Retrieved 17 October 2015.
- ^ "Election Data 2010". Electoral Calculus. Archived from the original on 26 July 2013. Retrieved 17 October 2015.
- ^ "Election Data 2005". Electoral Calculus. Archived from the original on 15 October 2011. Retrieved 18 October 2015.
- ^ "Election Data 2001". Electoral Calculus. Archived from the original on 15 October 2011. Retrieved 18 October 2015.
- ^ "Election Data 1997". Electoral Calculus. Archived from the original on 15 October 2011. Retrieved 18 October 2015.
- ^ C. Rallings & M. Thrasher, The Media Guide to the New Parliamentary Constituencies, p.451 (Plymouth: LGC Elections Centre, 1995)
- ^ The 1997 election result is calculated relative to the notional, not the actual, 1992 result.
- ^ "Election Data 1992". Electoral Calculus. Archived from the original on 15 October 2011. Retrieved 18 October 2015.
- ^ "Politics Resources". Election 1992. Politics Resources. 9 April 1992. Archived from the original on 24 July 2011. Retrieved 6 December 2010.
- ^ "Election Data 1987". Electoral Calculus. Archived from the original on 15 October 2011. Retrieved 18 October 2015.
- ^ "Election Data 1983". Electoral Calculus. Archived from the original on 15 October 2011. Retrieved 18 October 2015.
Sources
edit- Election result 2015
- Election result, 2015 (BBC)
- Election result, 2010 (BBC)
- Election result, 2005 (BBC)
- Election results, 1997–2001 (BBC)
- Election results, 1997–2001 (Election Demon)
- Election results, 1983–1997 (Election Demon)
External links
edit- Oxford West and Abingdon UK Parliament constituency (boundaries April 2010 – May 2024) at MapIt UK
- Oxford West and Abingdon UK Parliament constituency (boundaries from June 2024) at MapIt UK