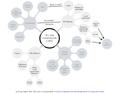
A mind map is a diagram used to visually organize information into a hierarchy, showing relationships among pieces of the whole.[1] It is often created around a single concept, drawn as an image in the center of a blank page, to which associated representations of ideas such as images, words and parts of words are added. Major ideas are connected directly to the central concept, and other ideas branch out from those major ideas.

Mind maps can also be drawn by hand, either as "notes" during a lecture, meeting or planning session, for example, or as higher quality pictures when more time is available. Mind maps are considered to be a type of spider diagram.[2]
Origin
editAlthough the term "mind map" was first popularized by British popular psychology author and television personality Tony Buzan,[3][4] the use of diagrams that visually "map" information using branching and radial maps traces back centuries.[5] These pictorial methods record knowledge and model systems, and have a long history in learning, brainstorming, memory, visual thinking, and problem solving by educators, engineers, psychologists, and others. Some of the earliest examples of such graphical records were developed by Porphyry of Tyros, a noted thinker of the 3rd century, as he graphically visualized the concept categories of Aristotle.[5] Philosopher Ramon Llull (1235–1315) also used such techniques.[5]
Buzan's specific approach, and the introduction of the term "mind map", started with a 1974 BBC TV series he hosted, called Use Your Head.[6] In this show, and companion book series, Buzan promoted his conception of radial tree, diagramming key words in a colorful, radiant, tree-like structure.[7]
Differences from other visualizations
edit- Concept maps: Mind maps differ from concept maps in that mind maps are based on a radial hierarchy (tree structure) denoting relationships with a central concept,[8] whereas concept maps can be more free-form, based on connections between concepts in more diverse patterns.[9] Also, concept maps typically have text labels on the links between nodes. However, either can be part of a larger personal knowledge base system.
- Modeling graphs or graphical modeling languages: There is no rigorous right or wrong with mind maps, which rely on the arbitrariness of mnemonic associations to aid people's information organization and memory. In contrast, a modeling graph such as a UML diagram structures elements using a precise standardized iconography to aid the design of systems.
Research
editEffectiveness
editCunningham (2005) conducted a user study in which 80% of the students thought "mindmapping helped them understand concepts and ideas in science".[10] Other studies also report some subjective positive effects of the use of mind maps.[11][12] Positive opinions on their effectiveness, however, were much more prominent among students of art and design than in students of computer and information technology, with 62.5% vs 34% (respectively) agreeing that they were able to understand concepts better with mind mapping software.[11] Farrand, Hussain, and Hennessy (2002) found that spider diagrams (similar to concept maps) had limited, but significant, impact on memory recall in undergraduate students (a 10% increase over baseline for a 600-word text only) as compared to preferred study methods (a 6% increase over baseline).[13] This improvement was only robust after a week for those in the diagram group and there was a significant decrease in motivation compared to the subjects' preferred methods of note taking. A meta study about concept mapping concluded that concept mapping is more effective than "reading text passages, attending lectures, and participating in class discussions".[14] The same study also concluded that concept mapping is slightly more effective "than other constructive activities such as writing summaries and outlines". However, results were inconsistent, with the authors noting "significant heterogeneity was found in most subsets". In addition, they concluded that low-ability students may benefit more from mind mapping than high-ability students.
Features
editJoeran Beel and Stefan Langer conducted a comprehensive analysis of the content of mind maps.[15] They analysed 19,379 mind maps from 11,179 users of the mind mapping applications SciPlore MindMapping (now Docear) and MindMeister. Results include that average users create only a few mind maps (mean=2.7), average mind maps are rather small (31 nodes) with each node containing about three words (median). However, there were exceptions. One user created more than 200 mind maps, the largest mind map consisted of more than 50,000 nodes and the largest node contained ~7,500 words. The study also showed that between different mind mapping applications (Docear vs MindMeister) significant differences exist related to how users create mind maps.
Automatic creation
editThere have been some attempts to create mind maps automatically. Brucks & Schommer created mind maps automatically from full-text streams.[16] Rothenberger et al. extracted the main story of a text and presented it as mind map.[17] There is also a patent application about automatically creating sub-topics in mind maps.[18]
Tools
editMind-mapping software can be used to organize large amounts of information, combining spatial organization, dynamic hierarchical structuring and node folding. Software packages can extend the concept of mind-mapping by allowing individuals to map more than thoughts and ideas with information on their computers and the Internet, like spreadsheets, documents, Internet sites, images and videos.[19] It has been suggested that mind-mapping can improve learning/study efficiency up to 15% over conventional note-taking.[13]
Gallery
editThe following dozen examples of mind maps show the range of styles that a mind map may take, from hand-drawn to computer-generated and from mostly text to highly illustrated. Despite their stylistic differences, all of the examples share a tree structure that hierarchically connects sub-topics to a main topic.


.png)