The county of Surrey is divided into 11 parliamentary constituencies (sub-classified into four of borough type and seven of county status affecting the level of expenses permitted and status of returning officer). The county saw the vast bulk of its population and seats removed on the creation of the County of London in 1889 and its wider replacement the county of Greater London in 1965. Reflecting its mainly suburban and rural nature, all seats covering the present definition of Surrey have been held by Conservative MPs at each general election since 1885, with the exception of two Liberals in 1906 and 1 Liberal Democrat in 2001.
Constituencies edit
† Conservative ‡ Labour ¤ Liberal Democrat
| Constituency[nb 1] | Electorate[1] | Majority[2][nb 2] | Member of Parliament[2] | Nearest opposition[2] | Map | ||
|---|---|---|---|---|---|---|---|
| East Surrey | 83,148 | 24,040 | Claire Coutinho† | Alex Ehmann¤ |  | ||
| Epsom and Ewell | 81,138 | 17,873 | Chris Grayling† | Stephen Gee¤ |  | ||
| Esher and Walton | 81,184 | 2,743 | Dominic Raab† | Monica Harding¤ |  | ||
| Guildford | 77,729 | 3,337 | Angela Richardson† | Zöe Franklin¤ |  | ||
| Mole Valley | 74,665 | 12,011 | Sir Paul Beresford† | Paul Kennedy¤ |  | ||
| Reigate | 74,242 | 18,310 | Crispin Blunt† | Susan Gregory‡ |  | ||
| Runnymede and Weybridge | 77,196 | 18,270 | Ben Spencer† | Robert King‡ |  | ||
| South West Surrey | 79,096 | 8,817 | Jeremy Hunt† | Paul Follows¤ |  | ||
| Spelthorne | 70,929 | 18,393 | Kwasi Kwarteng† | Pavitar Mann‡ |  | ||
| Surrey Heath | 81,349 | 18,349 | Michael Gove† | Alasdair Pinkerton¤ |  | ||
| Woking | 75,424 | 9,767 | Jonathan Lord† | Will Forster¤ |  | ||
Historic list of constituencies in Surrey edit
Used from 1950 to 1974 edit
- Chertsey
- Dorking
- Epsom
- Esher
- Farnham
- Guildford
- Reigate
- East Surrey
- Spelthorne (previous county: Middlesex abolished in 1965)
- Woking
Eleven other seats fell within the north-east of Surrey until 1965, forming the metropolitan part closest to London and the majority of the population (shown in the Historical Representation tables below). These were moved into Greater London leaving a predominantly suburban and rural content.
Used from 1974 to 1983 edit
- Chertsey and Walton
- Dorking
- East Surrey
- Epsom and Ewell
- Esher
- Farnham
- Guildford
- North West Surrey
- Reigate
- Spelthorne
- Woking
Used from 1983 to 1997 edit
2010 boundary changes edit
Under the Fifth Periodic Review of Westminster constituencies, the Boundary Commission for England decided to retain the existing 11 constituencies in Surrey, with only very minor changes to four of them.
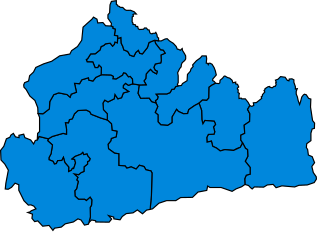
| Name | Boundaries 1997–2010 | Boundaries 2010–present |
|---|---|---|
 |  |
Proposed boundary changes edit
See 2023 Periodic Review of Westminster constituencies for further details.
Following the abandonment of the Sixth Periodic Review (the 2018 review), the Boundary Commission for England formally launched the 2023 Review on 5 January 2021.[3] Initial proposals were published on 8 June 2021 and, following two periods of public consultation, revised proposals were published on 8 November 2022. The final proposals were published on 28 June 2023.
The commission has proposed that Surrey be combined with Berkshire and Hampshire as a sub-region of the South East Region. As a result, the majority of the abolished constituency of South West Surrey would be combined with parts of the current constituency of East Hampshire to form a new cross-county boundary constituency named Farnham and Bordon. The remainder of South West Surrey would be combined with parts of Guildford, Mole Valley and Surrey Heath to form the new constituency of Godalming and Ash. The communities of Englefield Green and Virginia Water in the borough of Runnymede would be included in the Berkshire constituency of Windsor. Following changes to Mole Valley, it is proposed that this constituency is renamed Dorking and Horley.[4][5][6]
The following constituencies are proposed:
Containing electoral wards from Elmbridge
Containing electoral wards from Epsom and Ewell
- Epsom and Ewell (part)
Containing electoral wards from Guildford
- Guildford
- Surrey Heath (part)
- Godalming and Ash (part)
Containing electoral wards from Mole Valley
- Dorking and Horley (part)
- Epsom and Ewell (part)
Containing electoral wards from Reigate and Banstead
- Dorking and Horley (part)
- East Surrey (part)
- Reigate
Containing electoral wards from Runnymede
- Runnymede and Weybridge (part)
- Windsor (parts also in the Boroughs of Slough, and Windsor and Maidenhead in Berkshire)
Containing electoral wards from Spelthorne
Containing electoral wards from Surrey Heath
- Surrey Heath (part)
Containing electoral wards from Tandridge
- East Surrey (part)
Containing electoral wards from Waverley
- Dorking and Horley (part)
- Farnham and Bordon (part also in the District of East Hampshire)
- Godalming and Ash (part)
Containing electoral wards from Woking
Results history edit
Primary data source: House of Commons research briefing – General election results from 1918 to 2019[7]
2019 edit
The number of votes cast for each political party who fielded candidates in constituencies comprising Surrey in the 2019 general election were as follows:
| Party | Votes | % | Change from 2017 | Seats | Change from 2017 |
|---|---|---|---|---|---|
| Conservative | 336,561 | 53.7% | 11 | 0 | |
| Liberal Democrats | 179,581 | 28.6% | 0 | 0 | |
| Labour | 79,895 | 12.7% | 0 | 0 | |
| Greens | 17,165 | 2.7% | 0 | 0 | |
| Others | 13,670 | 2.3% | 0 | 0 | |
| Total | 626,872 | 100.0 | 11 |
Percentage votes edit
Note that before 1974 Surrey included a considerable part of what is now London.
| Election year | 1924 | 1929 | 1935 | 1945 | 1950 | 1951 | 1955 | 1959 | 1964 | 1966 | 1970 | 1974 (Feb) | 1974 (Oct) | 1979 | 1983 | 1987 | 1992 | 1997 | 2001 | 2005 | 2010 | 2015 | 2017 | 2019 |
|---|---|---|---|---|---|---|---|---|---|---|---|---|---|---|---|---|---|---|---|---|---|---|---|---|
| Conservative | 71.8 | 53.8 | 69.8 | 49.9 | 55.8 | 61.0 | 62.4 | 59.9 | 51.6 | 50.1 | 55.6 | 50.2 | 50.5 | 59.3 | 59.4 | 60.6 | 59.9 | 46.2 | 47.6 | 50.5 | 55.2 | 58.1 | 58.6 | 53.7 |
| Labour | 4.6 | 20.5 | 26.3 | 40.7 | 34.4 | 36.8 | 34.9 | 29.9 | 29.9 | 33.3 | 30.3 | 20.1 | 23.5 | 20.2 | 11.0 | 11.4 | 13.6 | 22.3 | 21.8 | 16.7 | 9.8 | 13.0 | 21.2 | 12.7 |
| Liberal Democrat1 | 23.6 | 25.7 | 3.9 | 9.0 | 9.8 | 2.3 | 2.7 | 10.3 | 18.4 | 16.5 | 13.8 | 29.3 | 25.6 | 19.8 | 28.6 | 27.6 | 25.5 | 24.5 | 27.0 | 28.4 | 28.5 | 9.8 | 13.3 | 28.6 |
| Green Party | – | – | – | – | – | – | – | – | – | – | – | – | – | – | – | * | * | * | * | * | 0.6 | 4.6 | 2.3 | 2.7 |
| UKIP | – | – | – | – | – | – | – | – | – | – | – | – | – | – | – | – | – | * | * | * | 4.8 | 12.9 | 2.0 | * |
| Other | – | – | – | 0.4 | 0.03 | – | – | – | 0.1 | 0.1 | 0.3 | 0.4 | 0.5 | 0.7 | 1.1 | 0.4 | 1.1 | 7.0 | 3.6 | 4.4 | 1.1 | 1.6 | 2.6 | 2.2 |
1pre-1979 – Liberal Party; 1983 & 1987 – SDP-Liberal Alliance
* Included in Other
Accurate vote percentages cannot be obtained for the elections of 1918, 1922, 1923 and 1931 because at least one candidate stood unopposed.
Seats edit
| Election year | 1974 (Feb) | 1974 (Oct) | 1979 | 1983 | 1987 | 1992 | 1997 | 2001 | 2005 | 2010 | 2015 | 2017 | 2019 |
|---|---|---|---|---|---|---|---|---|---|---|---|---|---|
| Conservative | 11 | 11 | 11 | 11 | 11 | 11 | 11 | 10 | 11 | 11 | 11 | 11 | 11 |
| Liberal Democrat1 | 0 | 0 | 0 | 0 | 0 | 0 | 0 | 1 | 0 | 0 | 0 | 0 | 0 |
| Total | 11 | 11 | 11 | 11 | 11 | 11 | 11 | 11 | 11 | 11 | 11 | 11 | 11 |
11974 & 1979 – Liberal Party; 1983 & 1987 – SDP-Liberal Alliance
General Election 2019, 2017, 2015 and 2010 results edit
The following tables show the results for all Surrey constituencies in the General Elections in 2019, 2017, 2015 and 2010. The results are given as percentages.
| 2019 | Con | Lib Dem | Lab | Green | UKIP | Other |
|---|---|---|---|---|---|---|
| East Surrey | 59.7 | 19.4 | 13.8 | 3.9 | – | 3.2 |
| Epsom and Ewell | 53.5 | 23.5 | 17.2 | 3.4 | – | 2.4 |
| Esher and Walton | 49.4 | 45.0 | 4.5 | – | – | 1.2 |
| Guildford | 44.9 | 39.2 | 7.7 | – | – | 8.2 |
| Mole Valley | 55.4 | 34.3 | 5.2 | 3.3 | 0.8 | 0.9 |
| Reigate | 53.9 | 19.4 | 19.5 | 6.0 | 1.2 | – |
| Runnymede and Weybridge | 54.9 | 17.3 | 20.6 | 3.5 | 0.9 | 2.8 |
| South West Surrey | 53.3 | 38.7 | 7.9 | – | – | – |
| Spelthorne | 58.9 | 15.1 | 21.7 | 4.3 | – | – |
| Surrey Heath | 58.6 | 27.3 | 9.2 | 3.8 | 1.1 | – |
| Woking | 48.9 | 30.8 | 16.4 | 2.8 | 1.1 | – |
| Average | 53.8 | 28.6 | 12.7 | 2.7 | 0.5 | 1.7 |
| 2017 | Con | Lab | Lib Dem | UKIP | Green | Others |
|---|---|---|---|---|---|---|
| East Surrey | 59.6 | 19.2 | 10.5 | 3.8 | 1.9 | 5.0 |
| Epsom and Ewell | 59.6 | 25.0 | 12.5 | – | 2.9 | – |
| Esher and Walton | 58.6 | 19.7 | 17.3 | 1.7 | 1.8 | 0.8 |
| Guildford | 54.6 | 19.0 | 23.9 | – | 2.1 | 0.5 |
| Mole Valley | 61.9 | 13.9 | 19.3 | 2.4 | 2.6 | – |
| Reigate | 57.4 | 24.7 | 10.9 | 2.9 | 4.1 | – |
| Runnymede and Weybridge | 60.9 | 25.9 | 7.3 | 3.2 | 2.6 | – |
| South West Surrey | 55.7 | 12.6 | 9.9 | 1.8 | – | 20.0 |
| Spelthorne | 57.3 | 30.5 | 5.5 | 4.6 | 2.2 | – |
| Surrey Heath | 64.2 | 21.1 | 10.8 | – | 3.9 | – |
| Woking | 54.1 | 23.9 | 17.6 | 2.1 | 2.0 | 0.4 |
| Average | 58.5 | 21.9 | 12.8 | 2.5 | 2.4 | 2.4 |
| 2015 | Con | Lab | UKIP | Lib Dem | Green | Others |
|---|---|---|---|---|---|---|
| East Surrey | 57.4 | 11.8 | 17.0 | 9.2 | 3.8 | 0.6 |
| Epsom and Ewell | 58.3 | 15.5 | 12.5 | 8.8 | 3.7 | 1.3 |
| Esher and Walton | 62.9 | 12.7 | 9.7 | 9.4 | 4.1 | 1.1 |
| Guildford | 57.1 | 12.1 | 8.8 | 15.5 | 4.7 | 1.8 |
| Mole Valley | 60.6 | 8.3 | 11.2 | 14.5 | 5.4 | – |
| Reigate | 56.8 | 12.8 | 13.3 | 10.5 | 6.7 | – |
| Runnymede and Weybridge | 59.7 | 15.5 | 13.9 | 6.7 | 4.1 | – |
| South West Surrey | 59.9 | 9.5 | 9.9 | 6.3 | 5.4 | 9.1 |
| Spelthorne | 49.7 | 18.6 | 20.9 | 6.4 | 3.5 | 1.0 |
| Surrey Heath | 59.9 | 11.2 | 14.3 | 9.1 | 4.4 | 1.2 |
| Woking | 56.2 | 16.1 | 11.3 | 11.6 | 4.1 | 0.6 |
| Average | 58.0 | 13.1 | 13.0 | 9.8 | 4.5 | 1.5 |
| 2010 | Con | Lib Dem | Lab | UKIP | Others |
|---|---|---|---|---|---|
| East Surrey | 56.7 | 25.9 | 9.0 | 6.9 | 1.5 |
| Epsom and Ewell | 56.2 | 26.8 | 11.9 | 4.6 | 0.5 |
| Esher and Walton | 58.9 | 24.8 | 10.7 | 3.3 | 2.3 |
| Guildford | 53.3 | 39.3 | 5.1 | 1.8 | 0.5 |
| Mole Valley | 57.5 | 28.7 | 7.0 | 5.1 | 1.6 |
| Reigate | 53.4 | 26.2 | 11.3 | 4.2 | 5.4 |
| Runnymede and Weybridge | 55.9 | 21.6 | 13.4 | 6.5 | 2.5 |
| South West Surrey | 58.7 | 30.2 | 6.0 | 2.6 | 2.6 |
| Spelthorne | 47.1 | 25.9 | 16.5 | 8.5 | 2.2 |
| Surrey Heath | 57.6 | 25.8 | 10.2 | 6.3 | – |
| Woking | 50.3 | 37.4 | 8.0 | 3.8 | 0.5 |
| Average | 55.1 | 28.4 | 9.9 | 4.9 | 1.8 |
Maps edit
1885–1910 edit
 1885
1885- 1886
- 1892
- 1895
- 1900
 1906
1906- Jan 1910
- Dec 1910


1918–1945 edit
 1918
1918 1922
1922- 1923
- 1924
- 1929
- 1931
- 1935
 1945
1945


1950–1970 edit
 1950
1950- 1951
 1955
1955- 1959
- 1964
 1966
1966- 1970


1974–present edit
 Feb 1974
- Oct 1974
- 1979
 1983
1983- 1987
- 1992
 1997
1997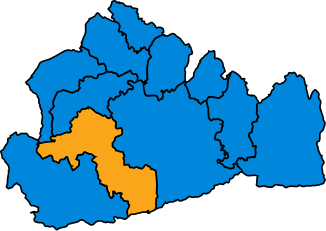 2001
2001- 2005
 2010
2010- 2015
- 2017
- 2019


Historical representation by party edit
A cell marked → (with a different colour background to the preceding cell) indicates that the previous MP continued to sit under a new party name.
1885 to 1918 edit
Conservative Liberal Liberal Unionist National Party
| Constituency | 1885 | 86 | 1886 | 92 | 1892 | 95 | 1895 | 97 | 99 | 1900 | 03 | 04 | 1906 | 07 | 09 | Jan 1910 | Dec 1910 | 12 | 16 | 17 |
|---|---|---|---|---|---|---|---|---|---|---|---|---|---|---|---|---|---|---|---|---|
| Chertsey | Hankey | Combe | Leigh-Bennett | Fyler | Bingham | Marnham | Macmaster | |||||||||||||
| Croydon | Grantham | Herbert | Ritchie | Arnold-Forster | Hermon-Hodge | Malcolm | ||||||||||||||
| Epsom | Cubitt | Bucknill | W. Keswick | H. Keswick | ||||||||||||||||
| Guildford | Brodrick | Cowan | Horne | |||||||||||||||||
| Kingston upon Thames | Ellis | Temple | Skewes-Cox | Cave | ||||||||||||||||
| Reigate | Lawrence | Cubitt | Brodie | Rawson | → | |||||||||||||||
| Wimbledon | Bonsor | Hambro | Chaplin | Coats | ||||||||||||||||
Note the 15 other seats of Surrey created in 1885 which primarily or wholly lay in the 1889-created County of London are not included in this list.
1918 to 1950 (12, then 14 MPs) edit
Conservative Independent Conservative Labour
† denotes seat which falls wholly or largely within present-day county of Greater London.
1950 to 1974 (19, then 20 MPs) edit
| Constituency | 1950 | 1951 | 54 | 1955 | 1959 | 60 | 1964 | 1966 | 1970 | 72 |
|---|---|---|---|---|---|---|---|---|---|---|
| Carshalton† | Head | Elliot | ||||||||
| Chertsey | Heald | Grylls | ||||||||
| Croydon East / Croydon NE (from 1955)† | Williams | Hughes-Hallett | Weatherill | |||||||
| Croydon North / Croydon NW (from 1955)† | Harris | Taylor | ||||||||
| Croydon West / Croydon S (from 1955)† | Thompson | Winnick | Thompson | |||||||
| Dorking | Touche | Sinclair | ||||||||
| Epsom | McCorquodale | Rawlinson | ||||||||
| Esher | Robson-Brown | Mather | ||||||||
| Farnham | Nicholson | Macmillan | ||||||||
| Guildford | Nugent | Howell | ||||||||
| Kingston upon Thames† | Boyd-Carpenter | |||||||||
| Merton and Morden† | Ryder | Atkins | Fookes | |||||||
| Mitcham† | Carr | |||||||||
| Reigate | Vaughan-Morgan | Howe | ||||||||
| Richmond (Surrey)† | Harvie-Watt | Royle | ||||||||
| Surrey East† | Astor | Doughty | Clark | |||||||
| Sutton and Cheam† | Marshall | Sharples | Tope | |||||||
| Wimbledon† | Black | Havers | ||||||||
| Woking | Watkinson | Onslow | ||||||||
| Surbiton† | Fisher | |||||||||
| Constituency | 1950 | 1951 | 54 | 1955 | 1959 | 60 | 1964 | 1966 | 1970 | 72 |
† denotes seat which falls wholly or largely within present-day county of Greater London
1974 to present (11 MPs) edit
In 1965 half (ten) of Surrey's constituencies were moved to the new county of Greater London, but constituencies based on the old boundaries continued to be used until 1974, when Surrey gained one constituency (Spelthorne) from the abolished administrative county of Middlesex.
Liberal Democrat MP Sue Doughty, who won Guildford in 2001 with a winning margin of 1.2%, was the first candidate to take a seat from the Conservatives in the area covered by the present county of Surrey in 56 years.
Conservative Independent Liberal Democrats Referendum Party
| Constituency | Feb 1974 | Oct 1974 | 78 | 1979 | 1983 | 84 | 1987 | 1992 | 97 | 1997 | 2001 | 2005 | 2010 | 2015 | 2017 | 19 | 2019 |
|---|---|---|---|---|---|---|---|---|---|---|---|---|---|---|---|---|---|
| Chertsey & Walton / Runnymede & Weybridge (1997) | Pattie | Hammond | → | Spencer | |||||||||||||
| Dorking (1974–83) / Mole Valley (1983–) | Sinclair | Wickenden | Baker | Beresford | |||||||||||||
| Epsom and Ewell | Rawlinson | Hamilton | Grayling | ||||||||||||||
| Esher (1974–97) / Esher and Walton (1997–) | Mather | Taylor | Raab | ||||||||||||||
| Farnham (1974–83) / SW Surrey (1983–) | Macmillan | Bottomley | Hunt | ||||||||||||||
| Guildford | Howell | St Aubyn | Doughty | Milton | → | Richardson | |||||||||||
| Reigate | Gardiner | → | Blunt | ||||||||||||||
| Spelthorne | Atkins | Wilshire | Kwarteng | ||||||||||||||
| Surrey East | Howe | Ainsworth | Gyimah | → | Coutinho | ||||||||||||
| Surrey NW (1974–97) / Surrey Heath (1997–) | Grylls | Hawkins | Gove | ||||||||||||||
| Woking | Onslow | Malins | Lord | ||||||||||||||
See also edit
Notes edit
References edit
- ^ Baker, Carl; Uberoi, Elise; Cracknell, Richard (28 January 2020). "General Election 2019: full results and analysis".
- ^ a b c "Constituencies A-Z – Election 2019". BBC News. Retrieved 24 April 2020.
- ^ "2023 Review | Boundary Commission for England". boundarycommissionforengland.independent.gov.uk. Retrieved 7 October 2021.
- ^ "Constituency Boundary changes on the way for 'Your Waverley' and Guildford". Waverley Web. 14 June 2021. Retrieved 15 November 2021.
- ^ "South West Surrey could be split in two". InYourArea.co.uk. 15 June 2021. Retrieved 15 November 2021.
- ^ "The 2023 Review of Parliamentary Constituency Boundaries in England – Volume one: Report | Boundary Commission for England". boundarycommissionforengland.independent.gov.uk. paras 916–940. Retrieved 10 July 2023.
- ^ Watson, Christopher; Uberoi, Elise; Loft, Philip (17 April 2020). "General election results from 1918 to 2019".