East Northamptonshire District Council in Northamptonshire, England was elected every four years. After the last boundary changes in 2007, 40 councillors were elected from 22 wards.[1] The district was abolished in 2021, with the area becoming part of North Northamptonshire.
Political control edit
From the first election to the council in 1973 until its abolition in 2021, political control of the council was held by the following parties:[2]
| Party in control | Years | |
|---|---|---|
| Conservative | 1973–1995 | |
| Labour | 1995–1999 | |
| Conservative | 1999–2021 | |
Leadership edit
The leaders of the council from 2009 until the council's abolition in 2021 were:
| Councillor | Party | From | To | |
|---|---|---|---|---|
| Andy Mercer | Conservative | Oct 2010 | ||
| Steven North[3] | Conservative | 4 Oct 2010 | 31 Mar 2021 | |
Council elections edit
- 1973 East Northamptonshire District Council election
- 1976 East Northamptonshire District Council election
- 1979 East Northamptonshire District Council election (New ward boundaries)[4]
- 1983 East Northamptonshire District Council election
- 1987 East Northamptonshire District Council election
- 1991 East Northamptonshire District Council election
- 1995 East Northamptonshire District Council election
- 1999 East Northamptonshire District Council election (New ward boundaries)[5][6]
- 2003 East Northamptonshire District Council election
- 2007 East Northamptonshire District Council election (New ward boundaries increased the number of seats by 4)[2][7]
- 2011 East Northamptonshire District Council election
- 2015 East Northamptonshire District Council election (Some new ward boundaries)[8]
Election results edit
| Overall control | Conservative | Labour | Lib Dem[a] | Independent | |||||
| 2015 | Conservative | 37 | 1 | - | 2 | ||||
| 2011 | Conservative | 35 | 2 | - | 3 | ||||
| 2007 | Conservative | 39 | - | - | 1 | ||||
| 2003 | Conservative | 33 | 3 | - | - | ||||
| 1999 | Conservative | 20 | 15 | - | 1 | ||||
| 1995 | Labour | 9 | 25 | 2 | - | ||||
| 1991 | Conservative | 23 | 9 | 3 | 1 | ||||
| 1987 | Conservative | 30 | 5 | 1 | - | ||||
| 1983 | Conservative | 30 | 6 | - | - | ||||
| 1979 | Conservative | 30 | 5 | - | 1 | ||||
- ^ SDP–Liberal Alliance in 1987.
District result maps edit
 1979 results map
 1983 results map
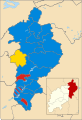 1987 results map
 1991 results map
 1995 results map
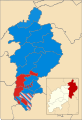 1999 results map
 2003 results map
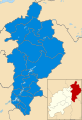 2007 results map
 2011 results map


By-election results edit
1995-1999 edit
| Party | Candidate | Votes | % | ±% | |
|---|---|---|---|---|---|
| Labour | 656 | 75.4 | |||
| Conservative | 214 | 24.6 | |||
| Majority | 442 | 50.8 | |||
| Turnout | 870 | 22.4 | |||
| Labour hold | Swing | ||||
| Party | Candidate | Votes | % | ±% | |
|---|---|---|---|---|---|
| Labour | 325 | 65.1 | |||
| Conservative | 174 | 34.9 | |||
| Majority | 151 | 30.2 | |||
| Turnout | 499 | ||||
| Labour hold | Swing | ||||
| Party | Candidate | Votes | % | ±% | |
|---|---|---|---|---|---|
| Labour | 365 | 43.3 | |||
| Conservative | 352 | 41.7 | |||
| Independent | 127 | 15.1 | |||
| Majority | 13 | 1.6 | |||
| Turnout | 844 | 18.5 | |||
| Labour hold | Swing | ||||
| Party | Candidate | Votes | % | ±% | |
|---|---|---|---|---|---|
| Labour | 712 | 67.0 | |||
| Conservative | 351 | 33.0 | |||
| Majority | 361 | 34.0 | |||
| Turnout | 1,063 | ||||
| Labour hold | Swing | ||||
| Party | Candidate | Votes | % | ±% | |
|---|---|---|---|---|---|
| Conservative | 525 | 55.7 | +15.2 | ||
| Labour | 418 | 44.3 | -15.2 | ||
| Majority | 107 | 11.4 | |||
| Turnout | 943 | 16.1 | |||
| Conservative gain from Labour | Swing | ||||
1999-2003 edit
| Party | Candidate | Votes | % | ±% | |
|---|---|---|---|---|---|
| Conservative | 316 | 64.5 | -6.6 | ||
| Labour | 174 | 35.5 | +6.6 | ||
| Majority | 142 | 29.0 | |||
| Turnout | 490 | 37.9 | |||
| Conservative hold | Swing | ||||
| Party | Candidate | Votes | % | ±% | |
|---|---|---|---|---|---|
| Conservative | 366 | 83.9 | |||
| Labour | 70 | 16.1 | |||
| Majority | 296 | 67.8 | |||
| Turnout | 436 | ||||
| Conservative hold | Swing | ||||
| Party | Candidate | Votes | % | ±% | |
|---|---|---|---|---|---|
| Conservative | 379 | 67.7 | -3.4 | ||
| Labour | 181 | 32.3 | +3.4 | ||
| Majority | 198 | 35.4 | |||
| Turnout | 560 | ||||
| Conservative hold | Swing | ||||
2003-2007 edit
| Party | Candidate | Votes | % | ±% | |
|---|---|---|---|---|---|
| Conservative | unopposed | ||||
| Conservative hold | Swing | ||||
| Party | Candidate | Votes | % | ±% | |
|---|---|---|---|---|---|
| Conservative | Sean Lever | 506 | 66.4 | +21.5 | |
| Labour | Stephen Allen | 256 | 33.6 | -2.9 | |
| Majority | 250 | 32.8 | |||
| Turnout | 762 | 15.8 | |||
| Conservative hold | Swing | ||||
2007-2011 edit
| Party | Candidate | Votes | % | ±% | |
|---|---|---|---|---|---|
| Conservative | Pam Whiting | unopposed | |||
| Conservative hold | Swing | ||||
2011-2015 edit
| Party | Candidate | Votes | % | ±% | |
|---|---|---|---|---|---|
| Conservative | Derek Capp | 412 | 64.1 | N/A | |
| Liberal Democrats | Karen Draycott | 130 | 20.2 | N/A | |
| Labour | Phil Garnham | 101 | 15.7 | N/A | |
| Majority | 282 | 43.9 | |||
| Turnout | 643 | ||||
| Conservative hold | Swing | ||||
| Party | Candidate | Votes | % | ±% | |
|---|---|---|---|---|---|
| Conservative | Jake Vowles | 1,003 | 52.4 | -13.7 | |
| Labour | Paul King | 681 | 35.6 | +1.7 | |
| Liberal Democrats | George Smid | 230 | 12.0 | +12.0 | |
| Majority | 322 | 16.8 | |||
| Turnout | 1,914 | ||||
| Conservative hold | Swing | ||||
| Party | Candidate | Votes | % | ±% | |
|---|---|---|---|---|---|
| Conservative | Alex Smith | 396 | 43.1 | -12.4 | |
| Independent | Valerie Carter | 210 | 22.9 | +22.9 | |
| Labour | Alex Izycky | 166 | 18.1 | +18.1 | |
| UKIP | Joseph Garner | 146 | 15.9 | +15.9 | |
| Majority | 186 | 20.3 | |||
| Turnout | 918 | ||||
| Conservative hold | Swing | ||||
2015-2021 edit
| Party | Candidate | Votes | % | ±% | |
|---|---|---|---|---|---|
| Conservative | Annabel de Capell Brooke | 729 | 82.8 | +6.7 | |
| Labour | Alan Brookfield | 151 | 17.2 | +2.8 | |
| Majority | 578 | 65.6 | |||
| Turnout | 880 | ||||
| Conservative hold | Swing | ||||
| Party | Candidate | Votes | % | ±% | |
|---|---|---|---|---|---|
| Conservative | Harriet Pentland | 611 | 55.6 | N/A | |
| Liberal Democrats | Suzanna Austin | 244 | 22.2 | N/A | |
| Labour | Mark Smith | 189 | 17.2 | N/A | |
| Green | Simon Turner | 33 | 3.0 | N/A | |
| UKIP | Bill Cross | 22 | 2.0 | N/A | |
| Majority | 367 | 33.4 | |||
| Turnout | 1,099 | ||||
| Conservative hold | Swing | ||||
| Party | Candidate | Votes | % | ±% | |
|---|---|---|---|---|---|
| Conservative | Lee Wilkes | 542 | 53.1 | -2.3 | |
| Labour | Caroline Cross | 478 | 46.9 | +11.7 | |
| Majority | 64 | 6.3 | |||
| Turnout | 1,020 | ||||
| Conservative hold | Swing | ||||
| Party | Candidate | Votes | % | ±% | |
|---|---|---|---|---|---|
| Conservative | Bert Jackson | 1,379 | 63.3 | +16.1 | |
| Liberal Democrats | Suzanna Austin | 800 | 36.7 | +36.7 | |
| Majority | 579 | 26.6 | |||
| Turnout | 2,179 | ||||
| Conservative hold | Swing | ||||
| Party | Candidate | Votes | % | ±% | |
|---|---|---|---|---|---|
| Conservative | Peter Tomas | 1,531 | 62.6 | N/A | |
| Liberal Democrats | Simon Baylis | 913 | 37.4 | N/A | |
| Majority | 618 | 25.2 | |||
| Turnout | 2,444 | ||||
| Conservative hold | Swing | ||||
References edit
🔥 Top keywords: Akademia e Shkencave e RPS te ShqiperiseAlexandria Ocasio-CortezBilderberg GroupCristiano RonaldoDong XiaowanMinecraftOperation GladioPrimal cutRiot FestStrictly Come Dancing (series 7)Main PageSpecial:SearchWikipedia:Featured picturesIga ŚwiątekRamoji RaoHit Man (2023 film)Pawan KalyanMichael Mosley (broadcaster)2024 Indian general electionWilliam AndersChirag PaswanCleopatraJasmine PaoliniPat SajakProject 20252024 ICC Men's T20 World CupDeaths in 2024Glen PowellKidnapping of Noa ArgamaniAdria ArjonaBad Boys: Ride or DieEarthriseVanna WhiteThe Acolyte (TV series)UEFA Euro 2024YouTubeThe Watchers (film)Beechcraft T-34 MentorSabrina CarpenterNormandy landingsBarry Keoghan.xxxGodzilla Minus OneTaylor SwiftN. Chandrababu NaiduClash at the Castle: ScotlandICC Men's T20 World CupTom Jones (singer)LAC Colombia Flight 028