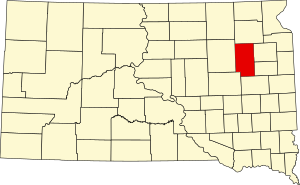
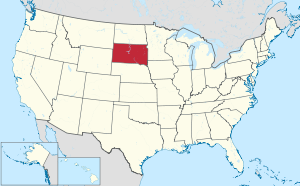
Clark County is a county in the U.S. state of South Dakota. As of the 2020 census, the population was 3,837.[1] Its county seat is Clark.[2] The county was created in 1873 and organized in 1881.[3] It was named for Newton Clark, a Dakota Territory legislator in 1873.[4][5]
Clark County | |
|---|---|
 Clark County Courthouse | |
 Location within the U.S. state of South Dakota | |
 South Dakota's location within the U.S. | |
| Coordinates: 44°52′N 97°44′W / 44.86°N 97.73°W | |
| Country | |
| State | |
| Founded | 1873 (created) 1881 (organized) |
| Named for | Newton Clark |
| Seat | Clark |
| Largest city | Clark |
| Area | |
| • Total | 967 sq mi (2,500 km2) |
| • Land | 958 sq mi (2,480 km2) |
| • Water | 9.9 sq mi (26 km2) 1.0% |
| Population (2020) | |
| • Total | 3,837 |
| • Estimate (2023) | 3,948 |
| • Density | 4.0/sq mi (1.5/km2) |
| Time zone | UTC−6 (Central) |
| • Summer (DST) | UTC−5 (CDT) |
| Congressional district | At-large |
| Website | http://clark.sdcounties.org/ |
Geography edit
Clark County terrain consists of rolling hills, dotted with lakes and ponds especially in the east central portion. The area is mostly devoted to agriculture.[6] The county has a total area of 967 square miles (2,500 km2), of which 958 square miles (2,480 km2) is land and 9.9 square miles (26 km2) (1.0%) is water.[7]
Major highways edit
Adjacent counties edit
- Day County - north
- Codington County - east
- Hamlin County - southeast
- Kingsbury County - south
- Beadle County - southwest
- Spink County - west
Protected areas edit
Lakes and reservoirs edit
Demographics edit
| Census | Pop. | Note | %± |
|---|---|---|---|
| 1880 | 114 | — | |
| 1890 | 6,728 | 5,801.8% | |
| 1900 | 6,942 | 3.2% | |
| 1910 | 10,901 | 57.0% | |
| 1920 | 11,136 | 2.2% | |
| 1930 | 11,022 | −1.0% | |
| 1940 | 8,955 | −18.8% | |
| 1950 | 8,369 | −6.5% | |
| 1960 | 7,134 | −14.8% | |
| 1970 | 5,515 | −22.7% | |
| 1980 | 4,894 | −11.3% | |
| 1990 | 4,403 | −10.0% | |
| 2000 | 4,143 | −5.9% | |
| 2010 | 3,691 | −10.9% | |
| 2020 | 3,837 | 4.0% | |
| 2023 (est.) | 3,948 | [21] | 2.9% |
| U.S. Decennial Census[22] 1790-1960[23] 1900-1990[24] 1990-2000[25] 2010-2020[1] | |||
2020 census edit
As of the 2020 census, there were 3,837 people, 1,361 households, and 853 families residing in the county.[26] The population density was 4.0 inhabitants per square mile (1.5/km2). There were 1,603 housing units.
2010 census edit
As of the 2010 census, there were 3,691 people, 1,445 households, and 929 families residing in the county. The population density was 3.9 inhabitants per square mile (1.5/km2). There were 1,710 housing units at an average density of 1.8 per square mile (0.69/km2). The racial makeup of the county was 98.1% white, 0.2% black or African American, 0.1% Asian, 0.1% American Indian, 0.8% from other races, and 0.8% from two or more races. Those of Hispanic or Latino origin made up 1.7% of the population. In terms of ancestry, 52.0% were German, 29.4% were Norwegian, 9.7% were Irish, 7.8% were English, 5.4% were Swedish, and 3.5% were American.
Of the 1,445 households, 23.0% had children under the age of 18 living with them, 55.8% were married couples living together, 4.8% had a female householder with no husband present, 35.7% were non-families, and 32.5% of all households were made up of individuals. The average household size was 2.22 and the average family size was 2.79. The median age was 45.7 years.
The median income for a household in the county was $43,894 and the median income for a family was $55,575. Males had a median income of $33,606 versus $24,952 for females. The per capita income for the county was $23,909. About 7.5% of families and 13.1% of the population were below the poverty line, including 24.5% of those under age 18 and 12.6% of those age 65 or over.
Communities edit
Cities edit
- Clark (county seat)
- Willow Lake
Towns edit
Census-designated place edit
Unincorporated communities edit
Townships edit
- Ash
- Blaine
- Collins
- Cottonwood
- Darlington
- Day
- Eden
- Fordham
- Foxton
- Garfield
- Hague
- Lake
- Lincoln
- Logan
- Maydell
- Merton
- Mount Pleasant
- Pleasant
- Raymond
- Richland
- Rosedale
- Spring Valley
- Thorp
- Warren
- Washington
- Woodland
Politics edit
Clark County is a reliable state bellwether, having voted for South Dakota's statewide winner in every presidential election since statehood, similar to Jackson County and Jones County. It is a strongly Republican county, having voted for the Republican candidate in presidential election since 1968.
| Year | Republican | Democratic | Third party | |||
|---|---|---|---|---|---|---|
| No. | % | No. | % | No. | % | |
| 2020 | 1,373 | 74.22% | 437 | 23.62% | 40 | 2.16% |
| 2016 | 1,139 | 68.74% | 398 | 24.02% | 120 | 7.24% |
| 2012 | 1,067 | 58.59% | 713 | 39.15% | 41 | 2.25% |
| 2008 | 1,065 | 54.90% | 830 | 42.78% | 45 | 2.32% |
| 2004 | 1,435 | 61.67% | 875 | 37.60% | 17 | 0.73% |
| 2000 | 1,272 | 60.34% | 791 | 37.52% | 45 | 2.13% |
| 1996 | 998 | 44.51% | 956 | 42.64% | 288 | 12.85% |
| 1992 | 803 | 33.81% | 799 | 33.64% | 773 | 32.55% |
| 1988 | 1,247 | 51.44% | 1,164 | 48.02% | 13 | 0.54% |
| 1984 | 1,748 | 64.31% | 960 | 35.32% | 10 | 0.37% |
| 1980 | 1,963 | 67.43% | 774 | 26.59% | 174 | 5.98% |
| 1976 | 1,449 | 51.06% | 1,376 | 48.48% | 13 | 0.46% |
| 1972 | 1,617 | 54.59% | 1,336 | 45.10% | 9 | 0.30% |
| 1968 | 1,596 | 52.50% | 1,325 | 43.59% | 119 | 3.91% |
| 1964 | 1,511 | 46.04% | 1,771 | 53.96% | 0 | 0.00% |
| 1960 | 2,204 | 61.05% | 1,406 | 38.95% | 0 | 0.00% |
| 1956 | 2,173 | 58.83% | 1,521 | 41.17% | 0 | 0.00% |
| 1952 | 2,692 | 71.44% | 1,076 | 28.56% | 0 | 0.00% |
| 1948 | 1,625 | 50.59% | 1,559 | 48.54% | 28 | 0.87% |
| 1944 | 1,936 | 61.56% | 1,209 | 38.44% | 0 | 0.00% |
| 1940 | 2,622 | 61.75% | 1,624 | 38.25% | 0 | 0.00% |
| 1936 | 1,883 | 46.07% | 2,036 | 49.82% | 168 | 4.11% |
| 1932 | 1,572 | 36.56% | 2,649 | 61.60% | 79 | 1.84% |
| 1928 | 2,665 | 65.46% | 1,370 | 33.65% | 36 | 0.88% |
| 1924 | 1,684 | 56.85% | 325 | 10.97% | 953 | 32.17% |
| 1920 | 1,753 | 60.24% | 437 | 15.02% | 720 | 24.74% |
| 1916 | 1,226 | 52.71% | 1,016 | 43.68% | 84 | 3.61% |
| 1912 | 0 | 0.00% | 668 | 38.48% | 1,068 | 61.52% |
| 1908 | 1,234 | 64.37% | 557 | 29.06% | 126 | 6.57% |
| 1904 | 1,409 | 73.85% | 276 | 14.47% | 223 | 11.69% |
| 1900 | 996 | 54.16% | 752 | 40.89% | 91 | 4.95% |
| 1896 | 695 | 45.01% | 816 | 52.85% | 33 | 2.14% |
| 1892 | 731 | 47.19% | 197 | 12.72% | 621 | 40.09% |


