
Size of this PNG preview of this SVG file: 800 × 320 pixels. Other resolutions: 320 × 128 pixels | 640 × 256 pixels | 1,024 × 410 pixels | 1,280 × 512 pixels | 2,560 × 1,024 pixels | 1,000 × 400 pixels.
Original file (SVG file, nominally 1,000 × 400 pixels, file size: 19 KB)
| This is a file from the Wikimedia Commons. Information from its description page there is shown below. Commons is a freely licensed media file repository. You can help. |
Summary
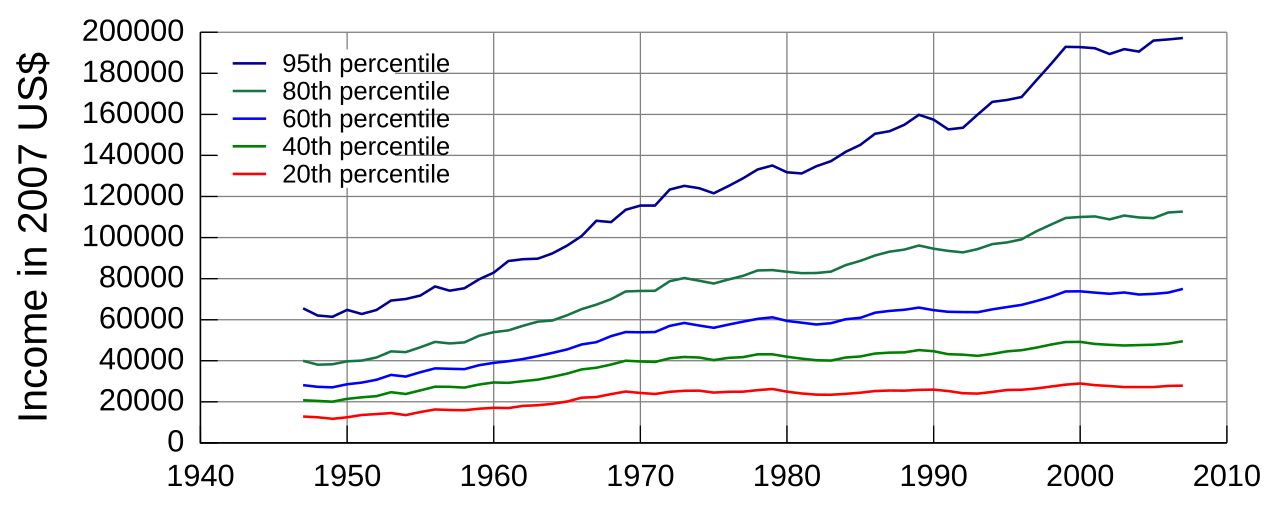
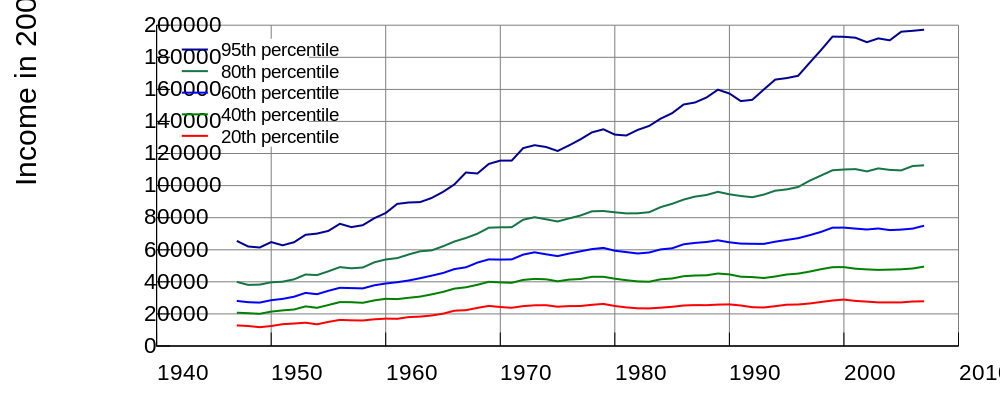
| Description | English: Graph of United States income distribution from 1947 through 2007 inclusive, normalized to 2007 dollars. The data source is "Table F-1. Income Limits for Each Fifth and Top 5 Percent of Families (All Races): 1947 to 2007", U.S. Census Bureau, Current Population Survey, Annual Social and Economic Supplements, as found at https://www.census.gov/hhes/www/income/histinc/f01AR.html[ archive copy at the Wayback Machine backup].This work is entirely my own, built using gnuplot 4.2. I relinquish any and all copyright claims I might have, releasing the work into the public domain. |
| Date | |
| Source | Own work |
| Author | Alan De Smet |
Recreating and raw data
The following should allow others to recreate the graph using gnuplot 4.2 or later.
The data file entitled "income-distribution-data" is as follows:
# Data:# https://www.census.gov/hhes/www/income/histinc/f01AR.html# https://www.webcitation.org/query?url=http%3A%2F%2Fwww.census.gov%2Fhhes%2Fwww%2Fincome%2Fhistinc%2Ff01AR.html&date=2009-04-12# Footnotes:# https://www.census.gov/hhes/www/income/histinc/ftnotes.html# archive copy at the Wayback Machine# # Historical Income Tables - Families # Table F-1. Income Limits for Each Fifth and Top 5 Percent of# Families (All Races): 1947 to 2007## (Families as of March of the following year. Income in current# and 2007 CPI-U-RS adjusted dollars 28/)# # Source: U.S. Census Bureau, Current Population Survey, Annual Social and Economic Supplements.# # The following data is always the 2007 CPI-U-RS adjusted dollars.#Year "Number" 20% 40% 60% 80% 95%2007 77908 27864 49510 75000 112638 1972162006 78454 27766 48333 73220 112246 1964802005 77418 27206 47816 72545 109501 1959552004 76866 27192 47640 72248 109769 1906032003 76232 27189 47413 73278 110707 1917442002 75616 27661 47761 72610 108879 1893882001 74340 28108 48166 73197 110264 1921912000 73778 28897 49173 73837 110017 1927901999 73206 28367 49143 73754 109547 1929041998 71551 27439 47882 71164 106318 1844521997 70884 26516 46371 69061 103046 1765691996 70241 25897 45155 67224 99109 1684361995 69597 25762 44560 66175 97618 1670511994 69313 24819 43302 65023 96840 1660751993 68506 23978 42390 63627 94379 1599251992 68216 24199 42966 63709 92740 1534981991 67173 25239 43219 63840 93519 1526571990 66322 25907 44666 64652 94564 1574141989 66090 25837 45207 65873 96145 1597791988 65837 25435 44095 64841 94156 1549461987 65204 25488 43967 64254 93113 1518121986 64491 25270 43500 63391 91278 1505351985 63558 24413 42057 60922 88628 1451111984 62706 23902 41577 60223 86604 1417961983 62015 23416 40107 58318 83390 1372391982 61393 23516 40274 57661 82731 1347411981 61019 24095 41016 58533 82688 1312331980 60309 24916 41950 59415 83372 1317661979 59550 26247 43160 61145 84195 1350711978 57804 25690 43167 60433 84000 1331751977 57215 24933 41754 59030 81333 1288751976 56710 24867 41414 57606 79561 1250471975 56245 24483 40314 56064 77625 1215901974 55698 25433 41553 57176 78980 1240521973 55053 25365 41854 58397 80309 1252001972 54373 24874 41221 56977 78718 1233781971 53296 23789 39389 53988 74039 1156141970 52227 24303 39647 53843 74009 1155581969 51586 25000 40000 54000 73755 1135151968 50823 23733 38128 52021 69988 1075411967 50111 22303 36611 49095 67305 1081441966 49214 22026 35812 47931 65154 1007541965 48509 20147 33748 45531 62166 960991964 47956 18995 32145 43834 59620 922731963 47540 18341 30805 42263 59058 897151962 47059 18018 30030 40840 57056 894881961 46418 16984 29237 39791 54804 885601960 45539 17057 29408 38991 53915 829321959 45111 16670 28426 37866 52182 797061958 44232 15884 26940 35912 48971 753401957 43696 16051 27315 36088 48417 741511956 43497 16244 27338 36267 49173 762121955 42889 15029 25578 34388 46575 717611954 41951 13554 23841 32276 44220 700751953 41202 14539 24673 33108 44588 693421952 40832 14048 22725 30744 41583 646981951 40578 13608 22186 29349 40073 628021950 39929 12488 21473 28578 39720 647721949 39303 11746 20067 27070 38253 614021948 38624 12443 20458 27315 38104 620501947 37237 12862 20755 28144 39934 65545
The files "commands is as follows:
set terminal svg size 1000 400 enhanced fname "Arial" fsize 18set grid back lw 1set border 3set logscale yset format y "%6.0f"set yrange [10000:500000]set ytics nomirror 10000,2,500000set xtics nomirrorset key top left Left reverse width -8 spacing 0.8 samplen 1set ylabel "Income in 2007 US$" font "Arial,24"set size ratio 0.4# Skipping linetype (lt) 4; it's cyan and not very dark against white backgrounds.plot \ "income-distribution-data" using 1:7 with lines lw 2 lt 6 title "{/Arial=15 95th percentile}",\ "income-distribution-data" using 1:6 with lines lw 2 lt 5 title "{/Arial=15 80th percentile}",\ "income-distribution-data" using 1:5 with lines lw 2 lt 3 title "{/Arial=15 60th percentile}",\ "income-distribution-data" using 1:4 with lines lw 2 lt 2 title "{/Arial=15 40th percentile}",\ "income-distribution-data" using 1:3 with lines lw 2 lt 1 title "{/Arial=15 20th percentile}"To create the graph, the follow command was used:
gnuplot < commands > out.svg
Licensing
| I, the copyright holder of this work, release this work into the public domain. This applies worldwide. In some countries this may not be legally possible; if so: I grant anyone the right to use this work for any purpose, without any conditions, unless such conditions are required by law. |
File history
Click on a date/time to view the file as it appeared at that time.
| Date/Time | Thumbnail | Dimensions | User | Comment | |
|---|---|---|---|---|---|
| current | 15:58, 22 February 2011 | 1,000 × 400 (19 KB) | TomSwiss | Undoing change to logarithmic scale, which obfuscates the actual trend of the data | |
| 21:51, 3 January 2010 | 1,000 × 400 (17 KB) | Ariel. | Convert to logarithmic scale. Linear scale is very misleading for this graph. | ||
| 18:15, 12 April 2009 | 1,000 × 400 (19 KB) | Alan De Smet | Typo in input files caused last data point to disappear. Fixed. | ||
| 18:12, 12 April 2009 | 1,000 × 400 (19 KB) | Alan De Smet | {{Information |Description={{en|1=Graph of United States income distribution from 1947 through 2007 inclusive, normalized to 2007 dollars. The data source is "Table F-1. Income Limits for Each Fifth and Top 5 Percent of Families (All Races): 1947 to 2007 |
File usage
The following pages on the English Wikipedia use this file (pages on other projects are not listed):
Global file usage
The following other wikis use this file:
- Usage on de.wikipedia.org
Metadata
🔥 Top keywords: Akademia e Shkencave e RPS te ShqiperiseAlexandria Ocasio-CortezBilderberg GroupCristiano RonaldoDong XiaowanMinecraftOperation GladioPrimal cutRiot FestStrictly Come Dancing (series 7)Main PageList of National Democratic Alliance membersSpecial:Search2019 Indian general election2024 Indian general electionNational Democratic AllianceIndian National Developmental Inclusive Alliance2014 Indian general electionList of Indian National Developmental Inclusive Alliance membersWikipedia:Featured picturesElection Commission of IndiaClaudia SheinbaumResults of the 2019 Indian general electionBharatiya Janata PartyLok SabhaSamajwadi PartyN. Chandrababu NaiduList of constituencies of the Lok SabhaTelugu Desam PartyJanata Dal (United)Nitish KumarList of National Democratic Alliance candidates in the 2024 Indian general electionIndian National Congress2024 Andhra Pradesh Legislative Assembly election2009 Indian general electionNarendra ModiDravida Munnetra KazhagamCleopatra2004 Indian general electionDeaths in 2024John Rose (Tennessee politician)Rahul GandhiYSR Congress PartyList of political parties in IndiaKylian MbappéLarry AllenList of prime ministers of IndiaRichard EvonitzYouTube