No higher resolution available.
Mollifier_illustration.png (500 × 158 pixels, file size: 6 KB, MIME type: image/png)
| This is a file from the Wikimedia Commons. Information from its description page there is shown below. Commons is a freely licensed media file repository. You can help. |
)
Summary
 | File:Mollifier Illustration.svg is a vector version of this file. It should be used in place of this PNG file when not inferior. File:Mollifier illustration.png → File:Mollifier Illustration.svg For more information, see Help:SVG. |
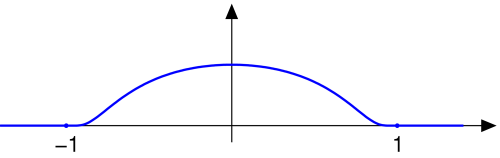
| Description | Français : fonction mollifiante, C_infini à support compact |
| Source | Own work This diagram was created with MATLAB. |
| Author | Oleg Alexandrov 08:56, 19 July 2007 (UTC) |
This diagram was created with MATLAB.
Licensing
| I, the copyright holder of this work, release this work into the public domain. This applies worldwide. In some countries this may not be legally possible; if so: I grant anyone the right to use this work for any purpose, without any conditions, unless such conditions are required by law. |
Source code (Matlab)
function main() thickness1=2; thickness2=1; arrowsize=5; arrow_type=2; ball_rad=0.012; blue=[0, 0, 1]; fontsize=25; dist=0.005; a=-1.4; b=-a; h=0.01; X=a:h:b; Y=zeros(length(X), 1); for i=1:length(X) x=X(i); if x < 1 & x > -1 Y(i)=exp(-1/(1-x^2)); end end figure(1); clf; hold on; axis equal; axis offarrow([a 0], [b+0.2, 0], thickness2, arrowsize, pi/8,arrow_type, [0, 0, 0])arrow([0 -0.1], [0 2.*max(Y)], thickness2, arrowsize, pi/8,arrow_type, [0, 0, 0])plot(X, Y, 'linewidth', thickness1, 'color', [0 0 1]);arrow([b+0.1 0], [b+0.2, 0], thickness2, arrowsize, pi/8,arrow_type, [0, 0, 0])ball(1, 0, ball_rad, blue); ball(-1, 0, ball_rad, blue);place_text_smartly(1, fontsize, 6, dist, '1');place_text_smartly(-1, fontsize, 6, dist, '-1');saveas(gcf, 'mollifier_illustration.eps', 'psc2')function place_text_smartly (z, fs, pos, d, tx) p=cos(pi/4)+sqrt(-1)*sin(pi/4); z = z + p^pos * d * fs; shiftx=0.0003; shifty=0.002; x = real (z); y=imag(z); H=text(x+shiftx*fs, y+shifty*fs, tx); set(H, 'fontsize', fs, 'HorizontalAlignment', 'c', 'VerticalAlignment', 'c')function ball(x, y, r, color) Theta=0:0.1:2*pi; X=r*cos(Theta)+x; Y=r*sin(Theta)+y; H=fill(X, Y, color); set(H, 'EdgeColor', color);function arrow(start, stop, thickness, arrowsize, sharpness, arrow_type, color)% draw a line with an arrow at the end% start is the x,y point where the line starts% stop is the x,y point where the line stops% thickness is an optional parameter giving the thickness of the lines % arrowsize is an optional argument that will give the size of the arrow % It is assumed that the axis limits are already set% 0 < sharpness < pi/4 determines how sharp to make the arrow% arrow_type draws the arrow in different styles. Values are 0, 1, 2, 3. % 8/4/93 Jeffery Faneuff% Copyright (c) 1988-93 by the MathWorks, Inc.% Modified by Oleg Alexandrov 2/16/03 if nargin <=6 color=[0, 0, 0]; end if (nargin <=5) arrow_type=0; % the default arrow, it looks like this: -> end if (nargin <=4) sharpness=pi/4; % the arrow sharpness - default = pi/4 end if nargin<=3 xl = get(gca,'xlim'); yl = get(gca,'ylim'); xd = xl(2)-xl(1); yd = yl(2)-yl(1); arrowsize = (xd + yd) / 2; % this sets the default arrow size end if (nargin<=2) thickness=0.5; % default thickness end xdif = stop(1) - start(1); ydif = stop(2) - start(2); if (xdif == 0) if (ydif >0) theta=pi/2; else theta=-pi/2; end else theta = atan(ydif/xdif); % the angle has to point according to the slope end if(xdif>=0) arrowsize = -arrowsize; end if (arrow_type == 0) % draw the arrow like two sticks originating from its vertex xx = [start(1), stop(1),(stop(1)+0.02*arrowsize*cos(theta+sharpness)),NaN,stop(1),... (stop(1)+0.02*arrowsize*cos(theta-sharpness))]; yy = [start(2), stop(2), (stop(2)+0.02*arrowsize*sin(theta+sharpness)),NaN,stop(2),... (stop(2)+0.02*arrowsize*sin(theta-sharpness))]; plot(xx,yy, 'LineWidth', thickness, 'color', color) end if (arrow_type == 1) % draw the arrow like an empty triangle xx = [stop(1),(stop(1)+0.02*arrowsize*cos(theta+sharpness)), ... stop(1)+0.02*arrowsize*cos(theta-sharpness)]; xx=[xx xx(1) xx(2)]; yy = [stop(2),(stop(2)+0.02*arrowsize*sin(theta+sharpness)), ... stop(2)+0.02*arrowsize*sin(theta-sharpness)]; yy=[yy yy(1) yy(2)]; plot(xx,yy, 'LineWidth', thickness, 'color', color) % plot the arrow stick plot([start(1) stop(1)+0.02*arrowsize*cos(theta)*cos(sharpness)], [start(2), stop(2)+ ... 0.02*arrowsize*sin(theta)*cos(sharpness)], 'LineWidth', thickness, 'color', color) end if (arrow_type==2) % draw the arrow like a full triangle xx = [stop(1),(stop(1)+0.02*arrowsize*cos(theta+sharpness)), ... stop(1)+0.02*arrowsize*cos(theta-sharpness),stop(1)]; yy = [stop(2),(stop(2)+0.02*arrowsize*sin(theta+sharpness)), ... stop(2)+0.02*arrowsize*sin(theta-sharpness),stop(2)]; % plot the arrow stick plot([start(1) stop(1)+0.01*arrowsize*cos(theta)], [start(2), stop(2)+ ... 0.01*arrowsize*sin(theta)], 'LineWidth', thickness, 'color', color) H=fill(xx, yy, color);% fill with black set(H, 'EdgeColor', 'none') end if (arrow_type==3) % draw the arrow like a filled 'curvilinear' triangle curvature=0.5; % change here to make the curved part more curved (or less curved) radius=0.02*arrowsize*max(curvature, tan(sharpness)); x1=stop(1)+0.02*arrowsize*cos(theta+sharpness); y1=stop(2)+0.02*arrowsize*sin(theta+sharpness); x2=stop(1)+0.02*arrowsize*cos(theta)*cos(sharpness); y2=stop(2)+0.02*arrowsize*sin(theta)*cos(sharpness); d1=sqrt((x1-x2)^2+(y1-y2)^2); d2=sqrt(radius^2-d1^2); d3=sqrt((stop(1)-x2)^2+(stop(2)-y2)^2); center(1)=stop(1)+(d2+d3)*cos(theta); center(2)=stop(2)+(d2+d3)*sin(theta); alpha=atan(d1/d2); Alpha=-alpha:0.05:alpha; xx=center(1)-radius*cos(Alpha+theta); yy=center(2)-radius*sin(Alpha+theta); xx=[xx stop(1) xx(1)]; yy=[yy stop(2) yy(1)];% plot the arrow stick plot([start(1) center(1)-radius*cos(theta)], [start(2), center(2)- ... radius*sin(theta)], 'LineWidth', thickness, 'color', color); H=fill(xx, yy, color);% fill with black set(H, 'EdgeColor', 'none') end| date/time | username | edit summary |
|---|---|---|
| 04:29, 23 November 2005 | en:User:Oleg Alexandrov | (rm space) |
| 04:27, 23 November 2005 | en:User:Mathbot | (source code) |
| 04:21, 23 November 2005 | en:User:Oleg Alexandrov |
Original upload log
Legend: (cur) = this is the current file, (del) = delete this old version, (rev) = revert to this old version.
Click on date to download the file or see the image uploaded on that date.
- (del) (cur) 04:47, 23 November 2005 . . en:User:Oleg_Alexandrov Oleg Alexandrov ( en:User_talk:Oleg_Alexandrov Talk) . . 500x158 (5669 bytes)
File history
Click on a date/time to view the file as it appeared at that time.
| Date/Time | Thumbnail | Dimensions | User | Comment | |
|---|---|---|---|---|---|
| current | 19:39, 19 March 2006 | 500 × 158 (6 KB) | Maksim | La bildo estas kopiita de wikipedia:en. La originala priskribo estas: == Licensing == {{PD-self}} ==Source code (Matlab)== <pre><nowiki> function main() thickness1=2; thickness2=1; arrowsize=5; arrow_type=2; ball_rad=0.012; blue=[0, 0, 1]; fo |
File usage
The following pages on the English Wikipedia use this file (pages on other projects are not listed):
Global file usage
The following other wikis use this file:
- Usage on ca.wikipedia.org
- Usage on de.wikipedia.org
- Usage on en.wikibooks.org
- Usage on it.wikipedia.org
- Usage on ko.wikipedia.org
- Usage on nl.wikipedia.org
- Usage on pt.wikipedia.org
- Usage on sv.wikipedia.org
🔥 Top keywords: Akademia e Shkencave e RPS te ShqiperiseAlexandria Ocasio-CortezBilderberg GroupCristiano RonaldoDong XiaowanMinecraftOperation GladioPrimal cutRiot FestStrictly Come Dancing (series 7)Main PageSpecial:SearchDonald SutherlandWikipedia:Featured picturesUEFA Euro 2024Kiefer Sutherland2024 Copa AméricaCleopatraTimothy MellonDeaths in 2024Copa AméricaDonald Sutherland filmographyUEFA European ChampionshipReggie JacksonJJ RedickChappell RoanRumpelstiltskinShirley DouglasRickwood FieldRossif SutherlandInside Out 2Taylor WilyFrancine RacetteHouse of the DragonSherri Papini kidnapping hoaxYouTubeWillie MaysThe Boys season 4The Boys (TV series)Sarah SutherlandAngus Sutherland (actor)Sabrina CarpenterNico WilliamsAntoine GriezmannThe Bikeriders2024 ICC Men's T20 World CupChristine ChubbuckOpinion polling for the 2024 United Kingdom general electionProject 2025